The State of New Business Ideas: H1 2026

Between August 2025 and June 2026, Fluenta collected 235,039 dated business-idea launches, the largest public record of what founders shipped, pitched, and discussed. Product Hunt carried the record through the autumn; from December 2025, coverage widened to all 146 sources. The full methodology and the live idea library sit in the Fluenta resources hub. This report reads the record: what the market built, what it abandoned, and what a founder should do about it right now.
The next edition, the state of new business ideas 2026 report for July and August 2026, extends this half-year picture with 181,011 new records and a nine-month Reddit series collected through Arctic Shift.
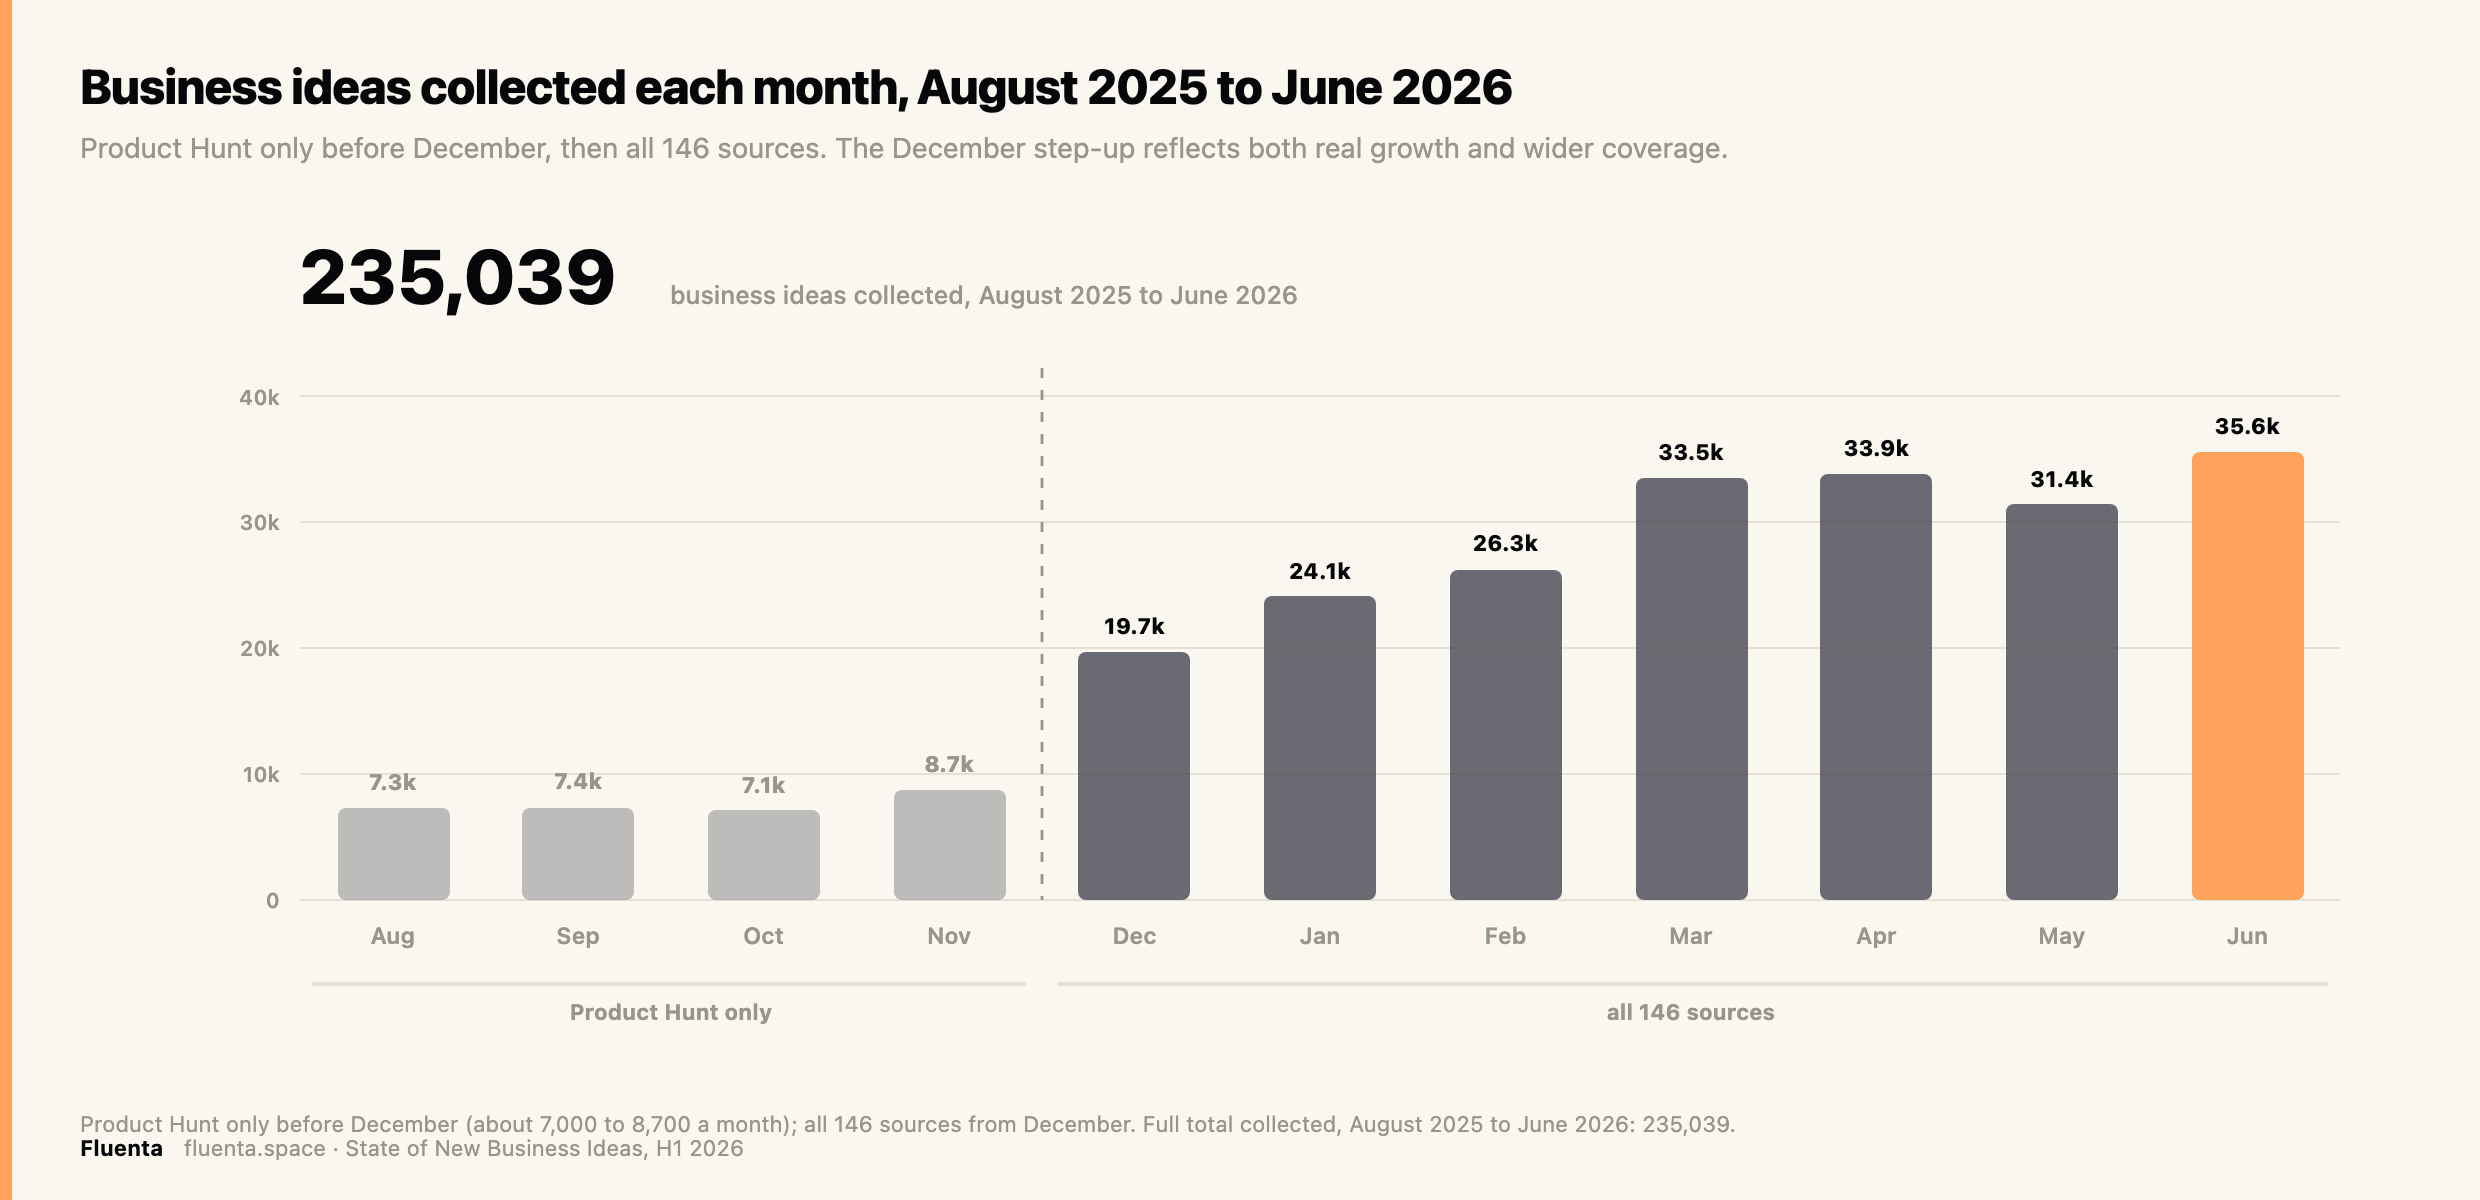
Product Hunt, the one source with an unbroken monthly record, grew from about 7,300 launches in August 2025 to about 21,600 in June 2026. From December, coverage widened to all 146 sources, lifting the monthly totals and bringing the full August 2025 to June 2026 count to the 235,039 shown above.
A launch is one dated product at one URL. It is not the same as an idea, and neither is the same as a business. Those three numbers are kept separate throughout, and every trend below discloses its basis.
The top 3 ranking business ideas of H1 2026 based on Launch Readiness Score
Tap a card to open the full scored idea on Fluenta, or the source link to see where it surfaced.

Python Automation Scripting
Source: Upwork Skills Index
SEO Content Workflow Engine
Source: TheresAnAIForThat
Open Vibe - AI SaaS coding flow
Source: Product HuntThe full top 20
The top 20 business ideas of H1 2026 with the highest Launch Readiness Score. Search and sort by score, sector, or source, then open any one's full scorecard.
Jump to all 20 ↓All the quotable numbers from this record, gathered on one page: Startup Statistics 2026.
The seven things that mattered in H1 2026
1. The launch wave roughly tripled. On Product Hunt, the one source with an unbroken monthly record, launches climbed from about 7,300 a month in August 2025 to about 21,600 in June 2026. The step change lands in March.
2. Implementation lag collapsed from months to days. The old rhythm of announce-now, build-next-quarter is gone. Google's open Gemma 4 model reached Hugging Face in 0 days and Product Hunt in 1. OpenAI's Codex appeared on every tracked platform within a day of release.
3. Open weights flood; closed models echo. Open models such as Gemma and Qwen spawn derivative launches on GitHub and Hugging Face within 0 to 3 days. Closed models such as Claude and GPT show up on launch platforms in 1 to 6 days but leave Hugging Face empty. A model nobody can download is a model nobody can fine-tune.
4. The market is maturing off raw AI. From January to June, Productivity and Collaboration gained 4.1 points of share and Marketing and Creator gained 2.6, while Developer Tools lost 3.8 and generic AI and Automation lost 3.4. The infrastructure land-grab is cooling and the application layer is heating.
5. Anthropic's paradox: mindshare, not moments. Claude releases barely spike in the data, a 1.07x lift on average. That is because Claude Code already runs at three to five times any rival's baseline mention rate. It is the single most persistent theme of the half-year. Sustained mindshare beats the release-day bump.
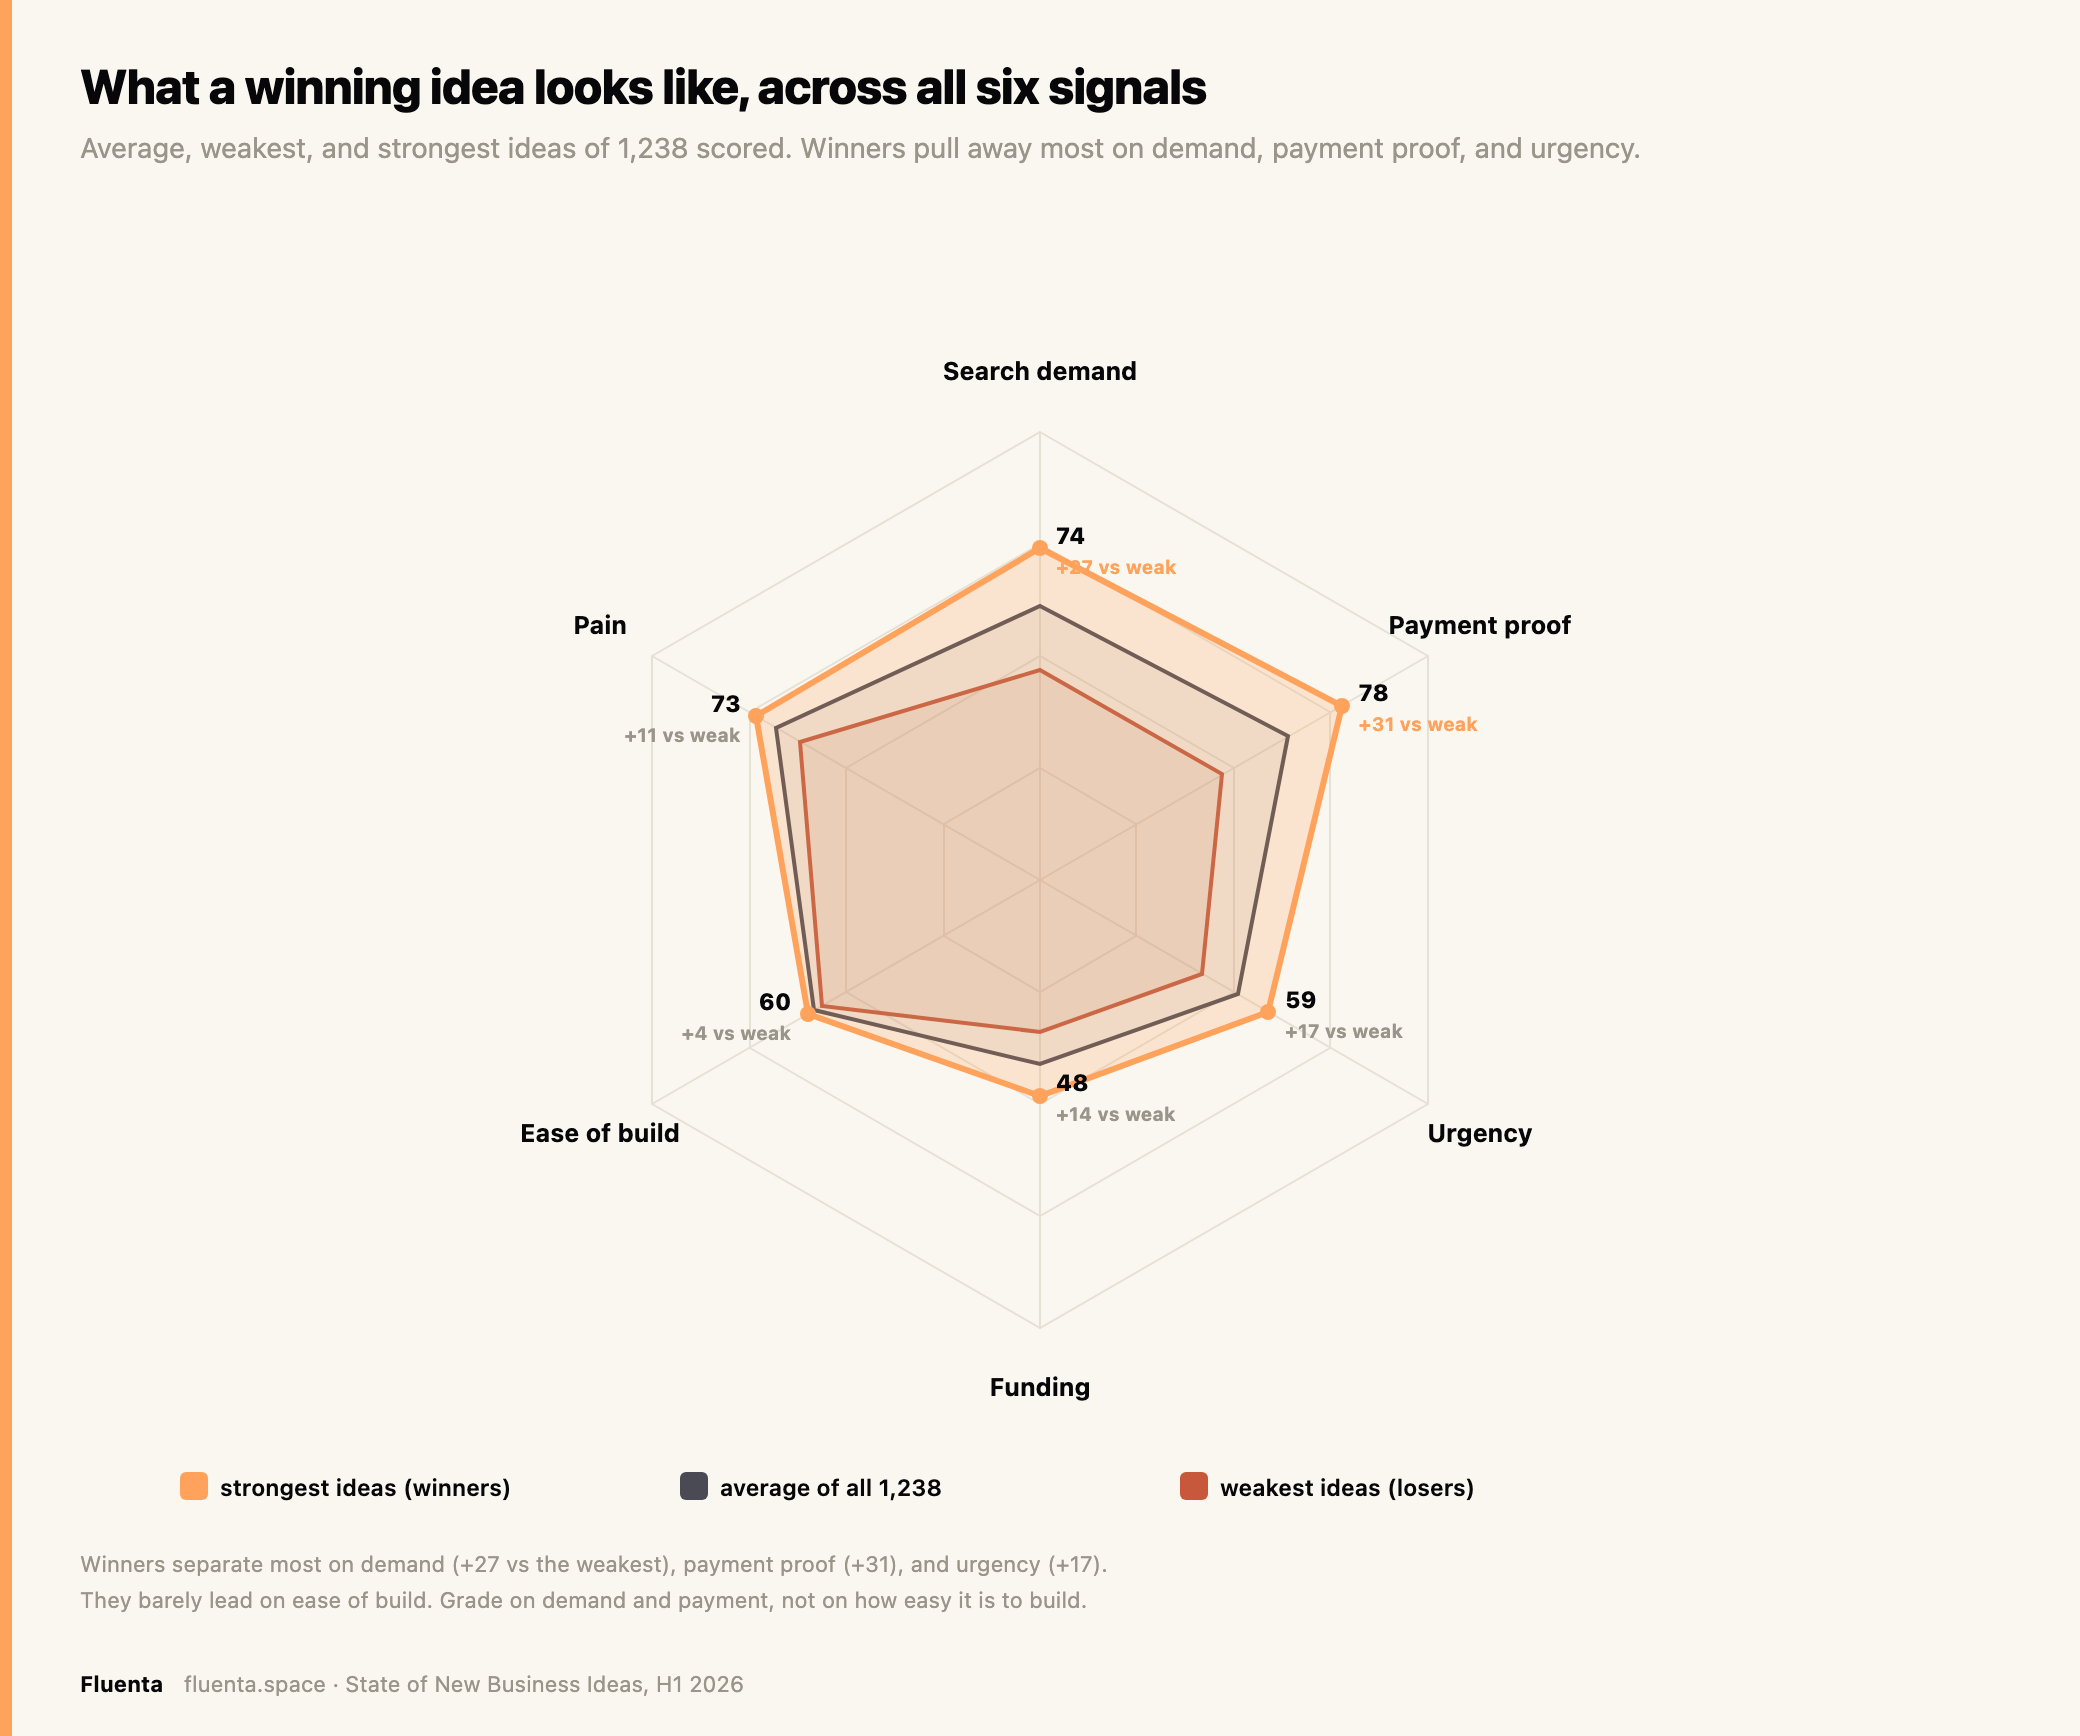
6. Winners are wanted, not merely painful. Across 1,238 ideas scored over four months, the top and bottom fifths separated most on search demand, by 28 points, and that gap held in every single month. Urgency added another 17. Pain, the thing founders obsess over, separated them by only 11. Willingness-to-pay looked decisive through May but collapsed by June as the signal saturated. The durable moat is proven demand, not proven payment.
7. Launch novelty runs at about 98 percent, yet the idea-space is crowded. Almost every individual launch is a genuinely new product. Almost none of the underlying ideas are new. Concrete is not the same as original.
The eighth finding earned its own section: ideas travel across sources on a clock, and the money is always last.
Subscribe to be the first to know
New business ideas, scored daily. Weekly trends, insights, idea kill lists.
Free. Subscribing creates your Fluenta account so you can score your own ideas too.
How this record gets built
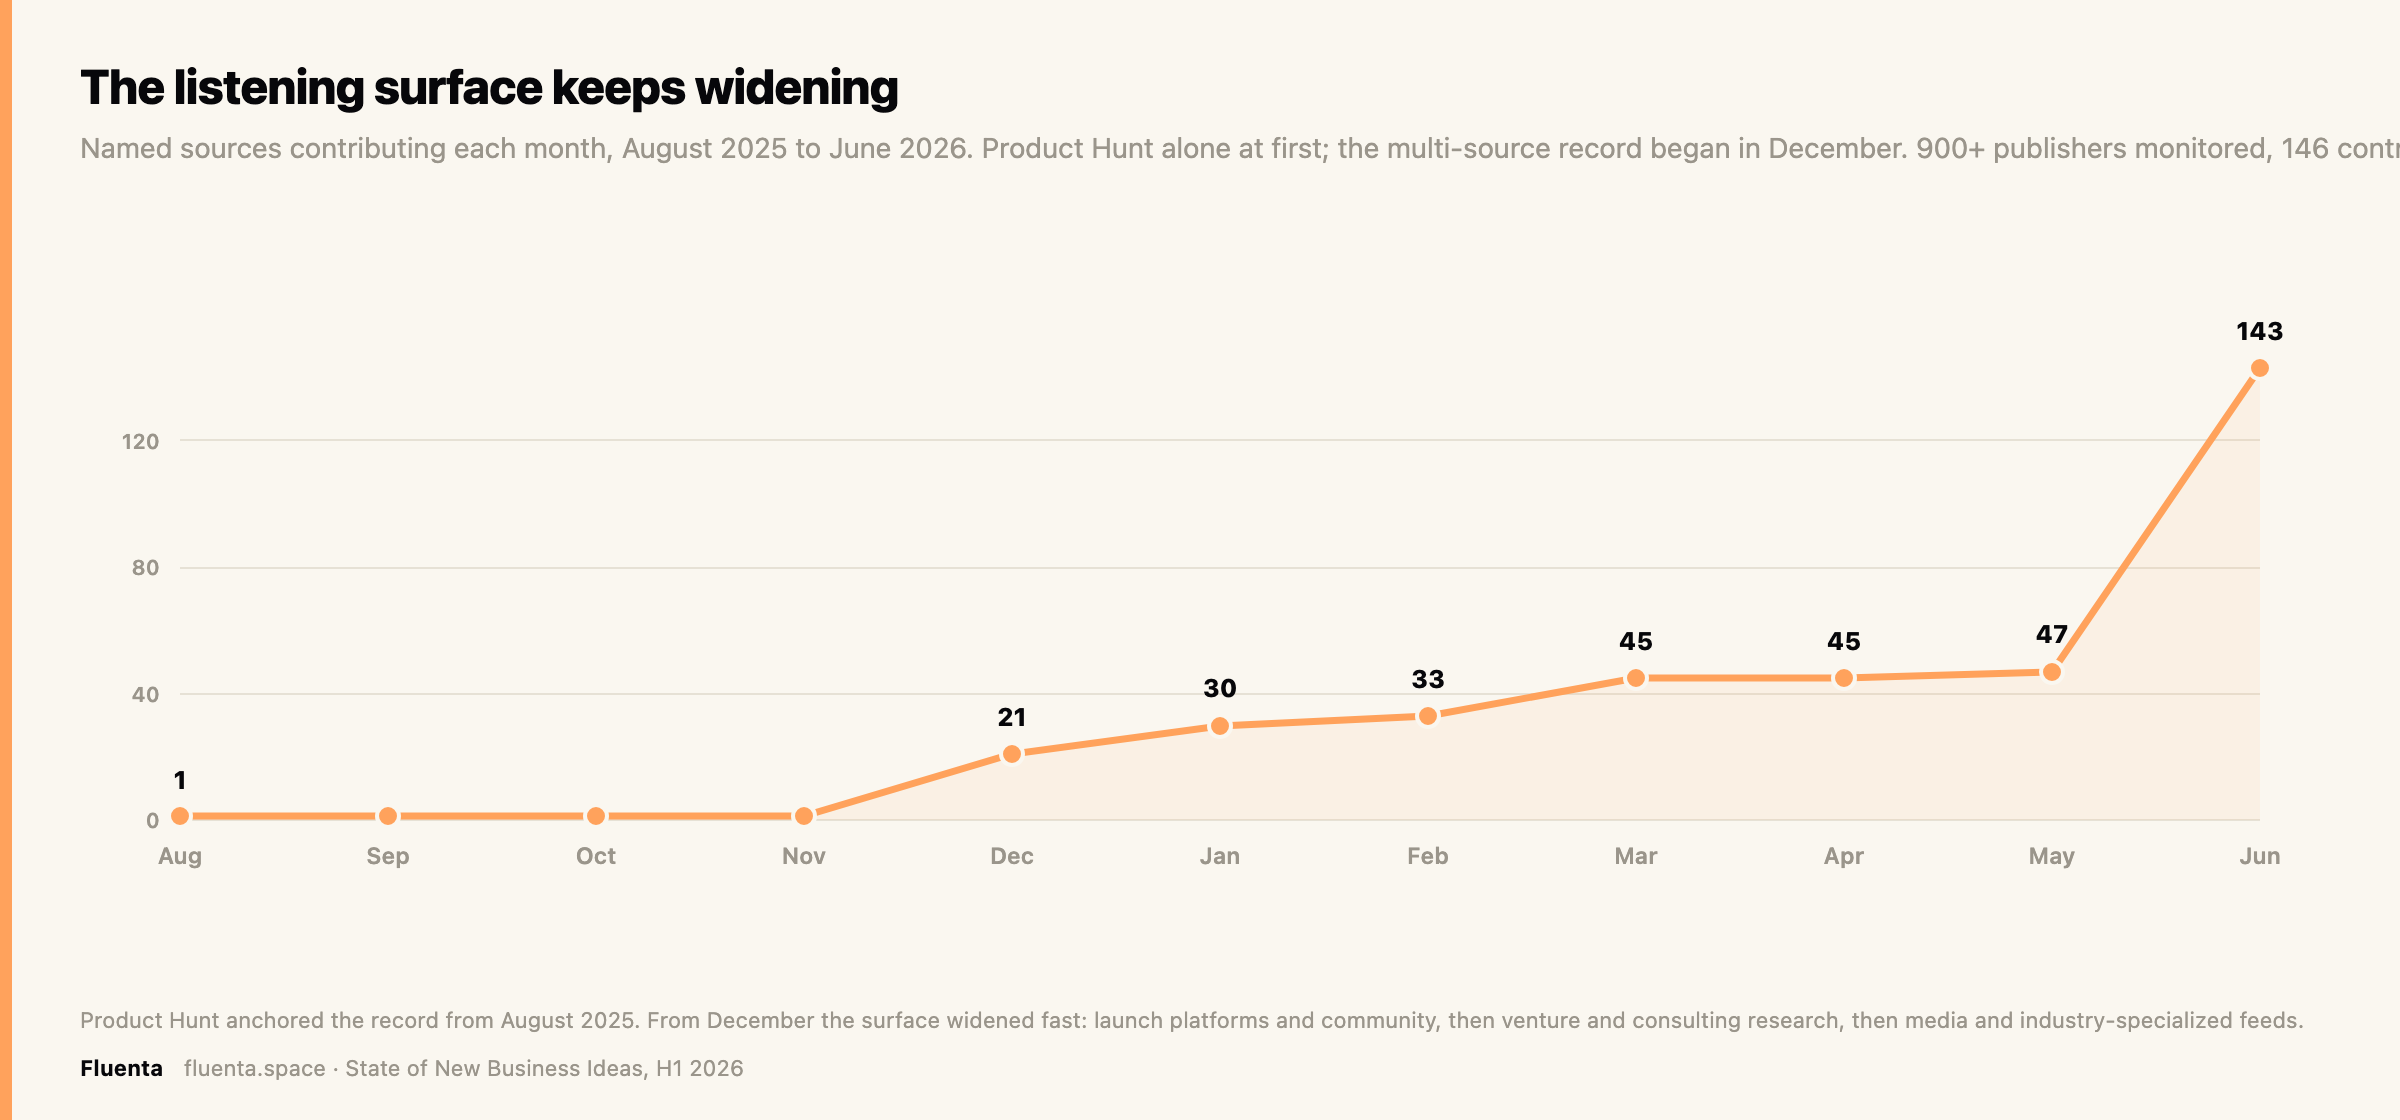
Fluenta's mission is to hear every new business idea the moment it surfaces and to name the trend before it is obvious. That is why the listening surface keeps widening. Collection began with Product Hunt in August 2025 and expanded outward, one source group at a time.
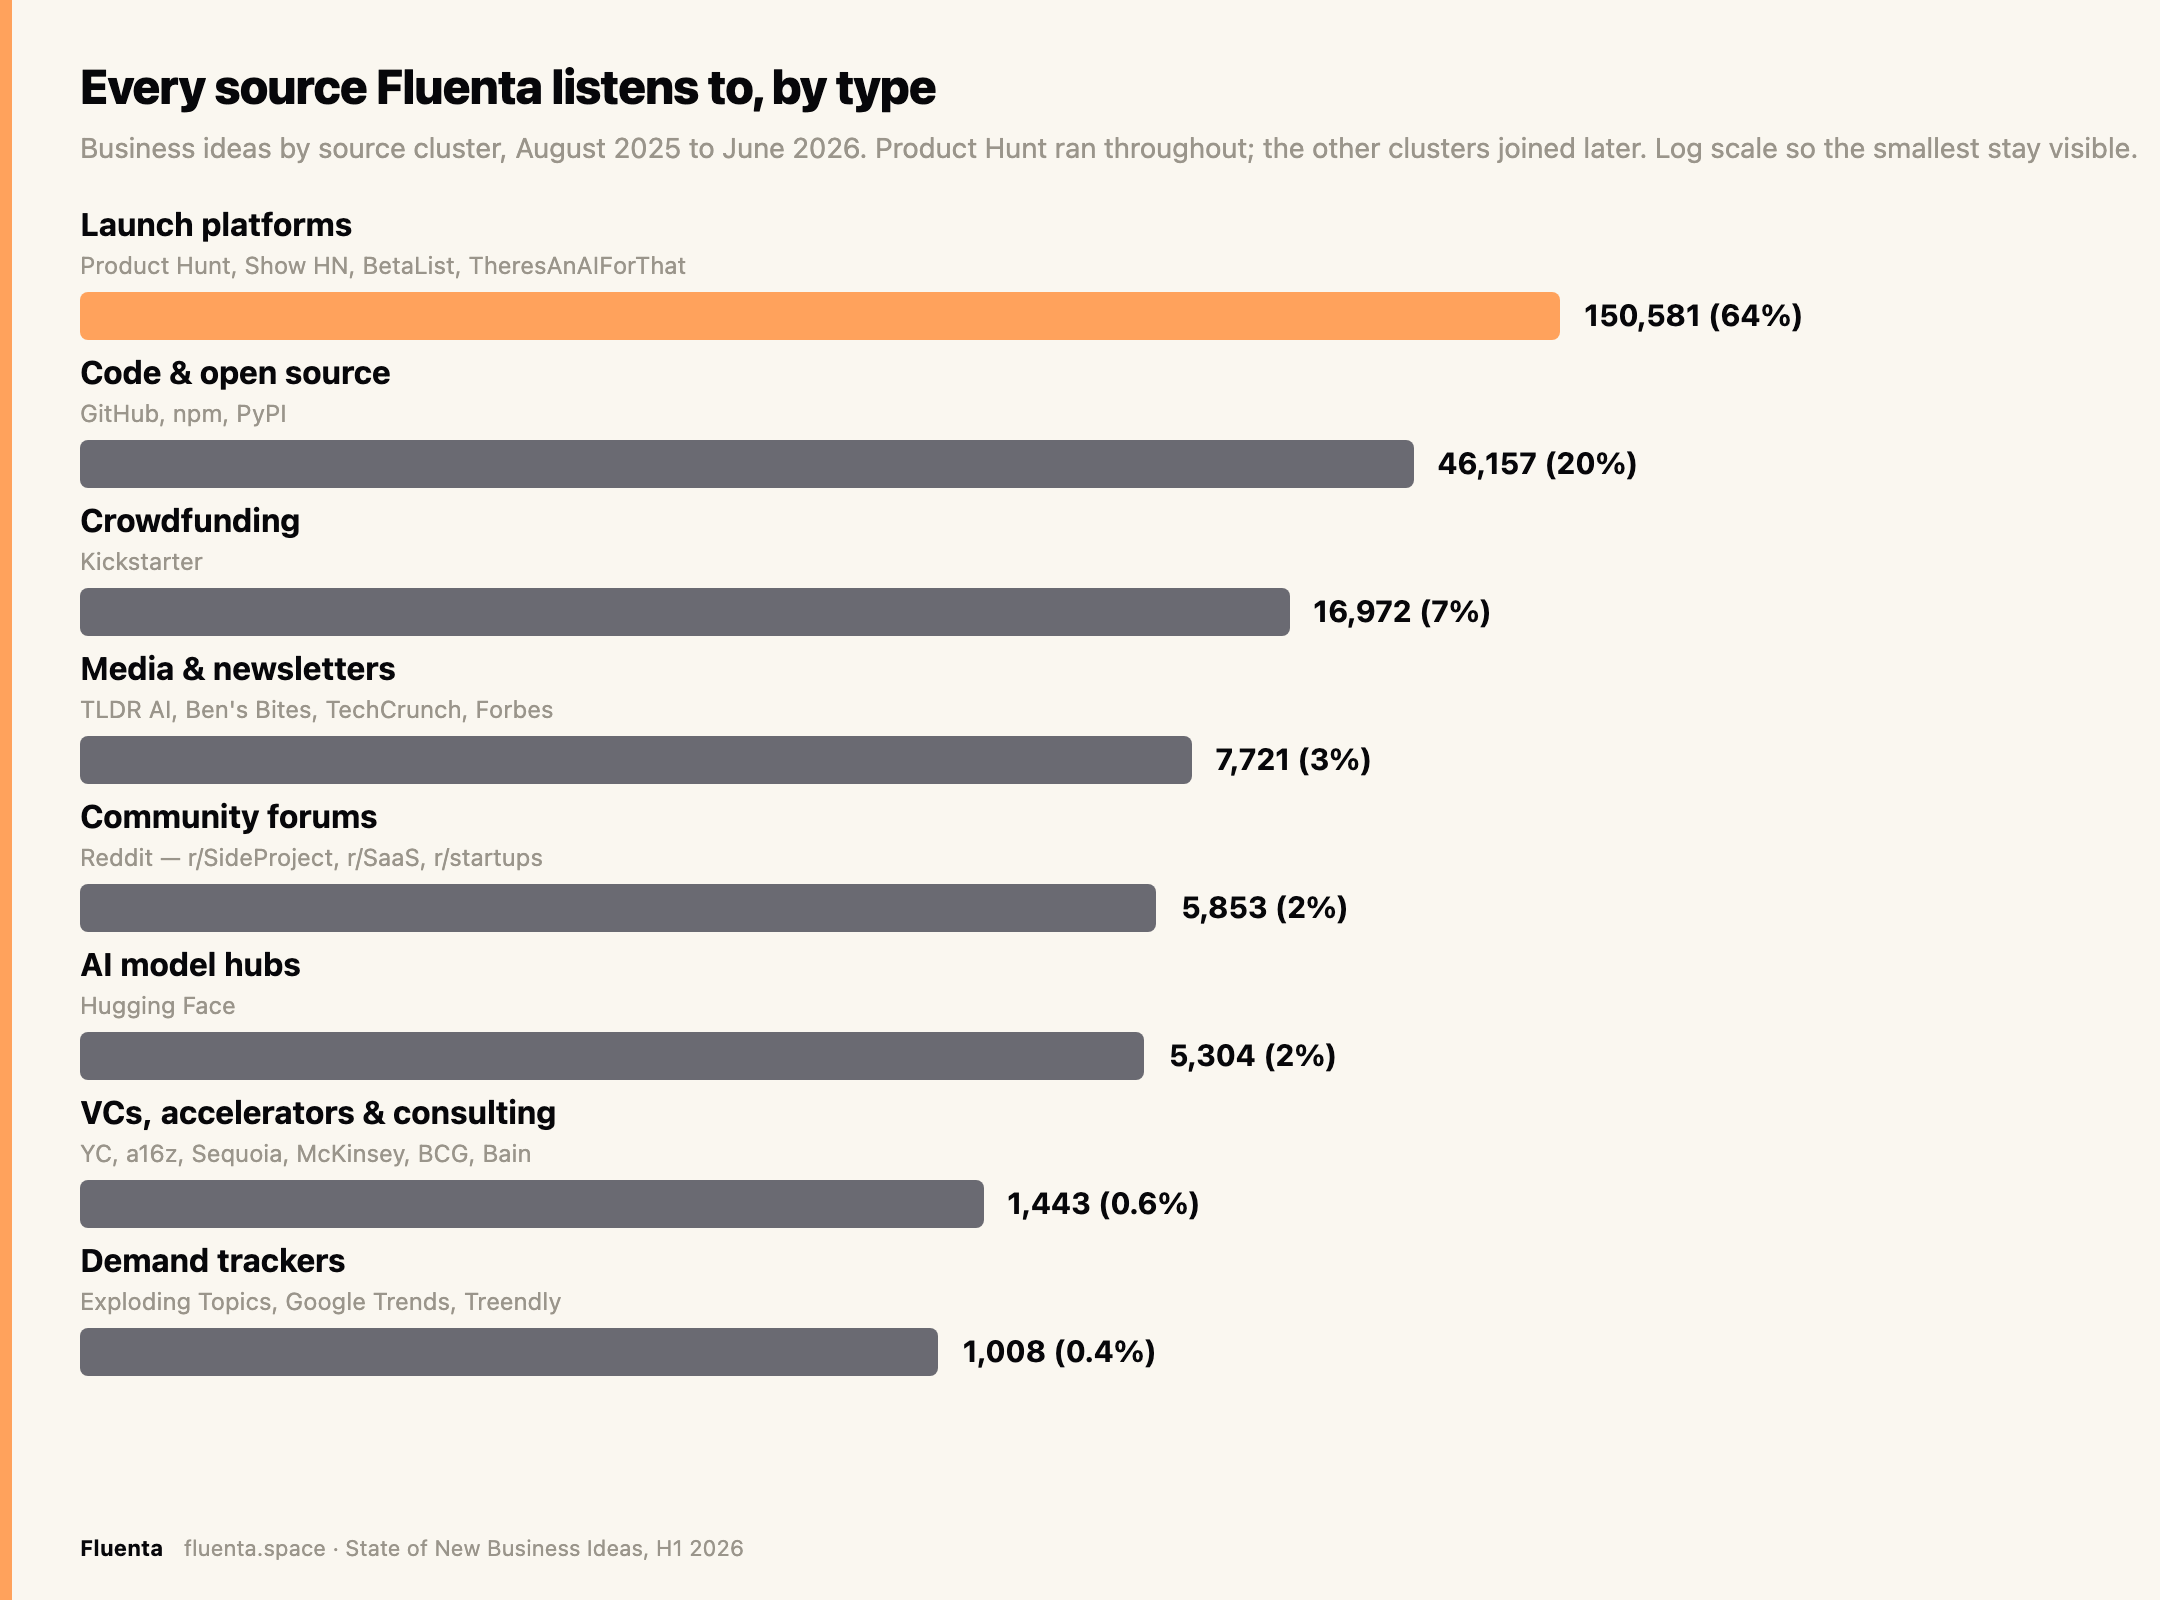
Fluenta monitors a registry of more than 900 publishers; across August 2025 to June 2026, 146 of them contributed dated launches, grouped into eight clusters. Launch platforms carry the bulk of the volume at about 150,000 launches, from Product Hunt, Show HN, BetaList, and TheresAnAIForThat. Code and open-source platforms add about 46,000 from GitHub, npm, and PyPI. Crowdfunding contributes about 17,000 from Kickstarter. Community forums, AI model hubs, and media and newsletters follow. The low-volume but high-signal clusters, venture and consulting research and the demand trackers, round it out.
The sources did not all arrive at once. The count grew month over month, each new kind of source widening what the index can hear: launch platforms and community first, then venture and accelerator research, then the consulting houses, then media and industry-specialized feeds.
Every record then runs the same four-stage pipeline: collect, classify, dedupe, and deep-score. One launch counts once after exact-URL de-duplication; morphological matching then folds the same idea under different names, within and across sources, leaving about 121,000 distinct ideas. A representative 1,238 were deep-scored through X-Ray on six public signals, demand, pain, competition, monetization, funding momentum, and urgency, for an average Launch Readiness Score of 45.
| Stage | Count |
|---|---|
| Collected, Aug 2025 to Jun 2026 | 235,039 |
| Unique after de-duplication | ~121,000 |
| Deep-scored on LRS | 1,238 |
| Average LRS | 45 / 100 |
| Publishers monitored | 900+ |
| Sources that contributed in H1 | 146 |
Every scored idea is published in the Fluenta idea library, searchable and free to browse. It is the fastest way to see what is already publicly validated and in demand. Run your own idea through the same six signals, free, at fluenta.space.
The launch wave, and where it accelerated
Product Hunt is the only source with a long enough continuous history to trend across eleven months, so it anchors the volume story.
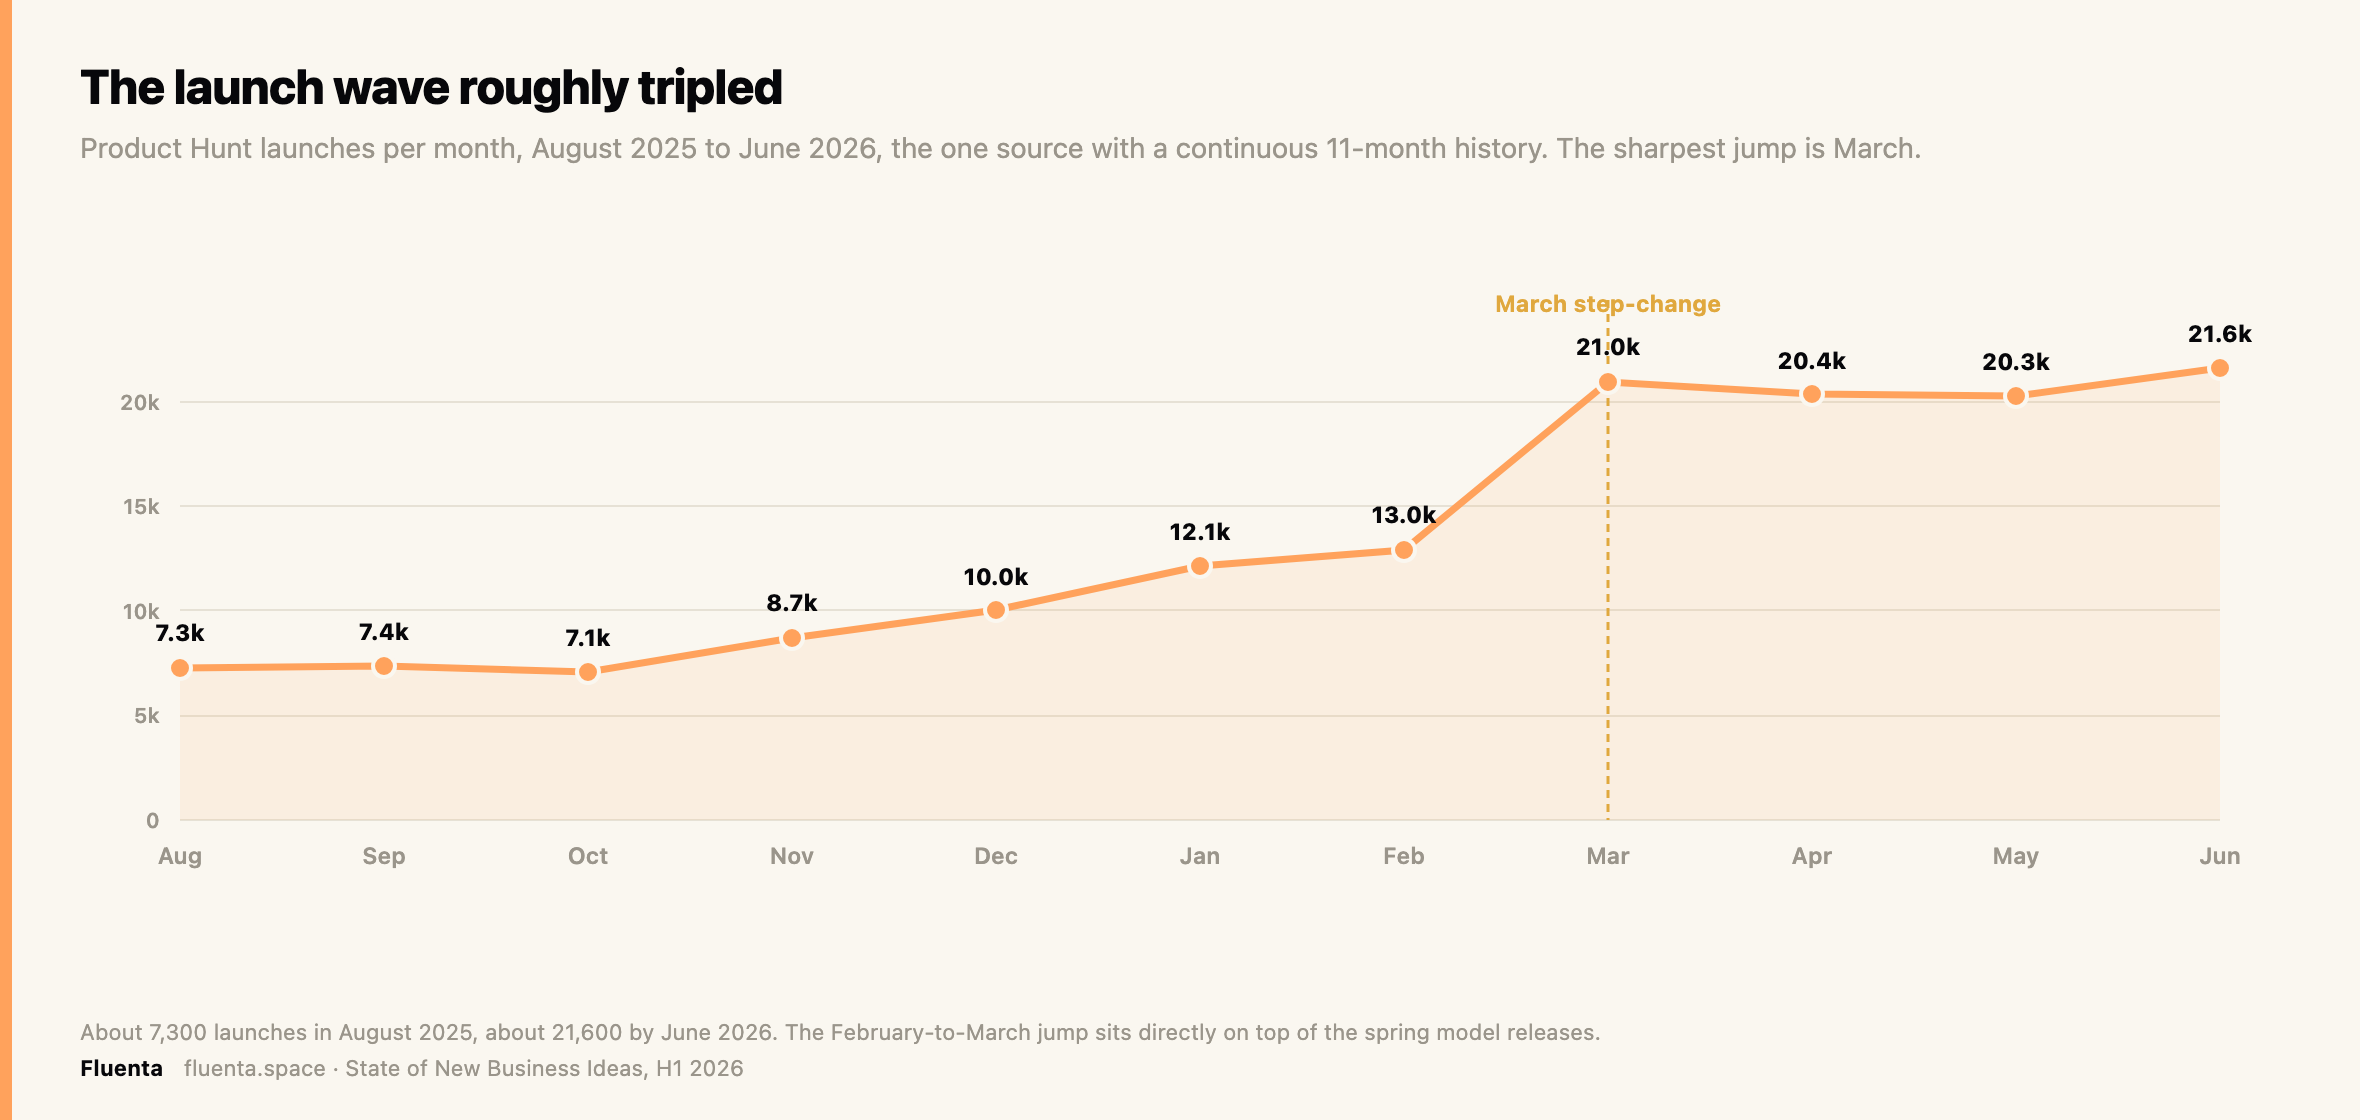
Launches on Product Hunt roughly tripled, from about 7,300 a month in August 2025 to about 21,600 by June 2026, and the sharpest jump lands in March. That inflection sits directly on top of the spring LLM model releases covered below.
What the market shipped, and what it abandoned
Underneath the rising volume, the composition of what founders build is rotating. The fastest-growing sectors by share of mentions were Productivity and Collaboration and Marketing and Creator tools. The steepest declines were Developer Tools, generic AI and Automation, and Media and Gaming.
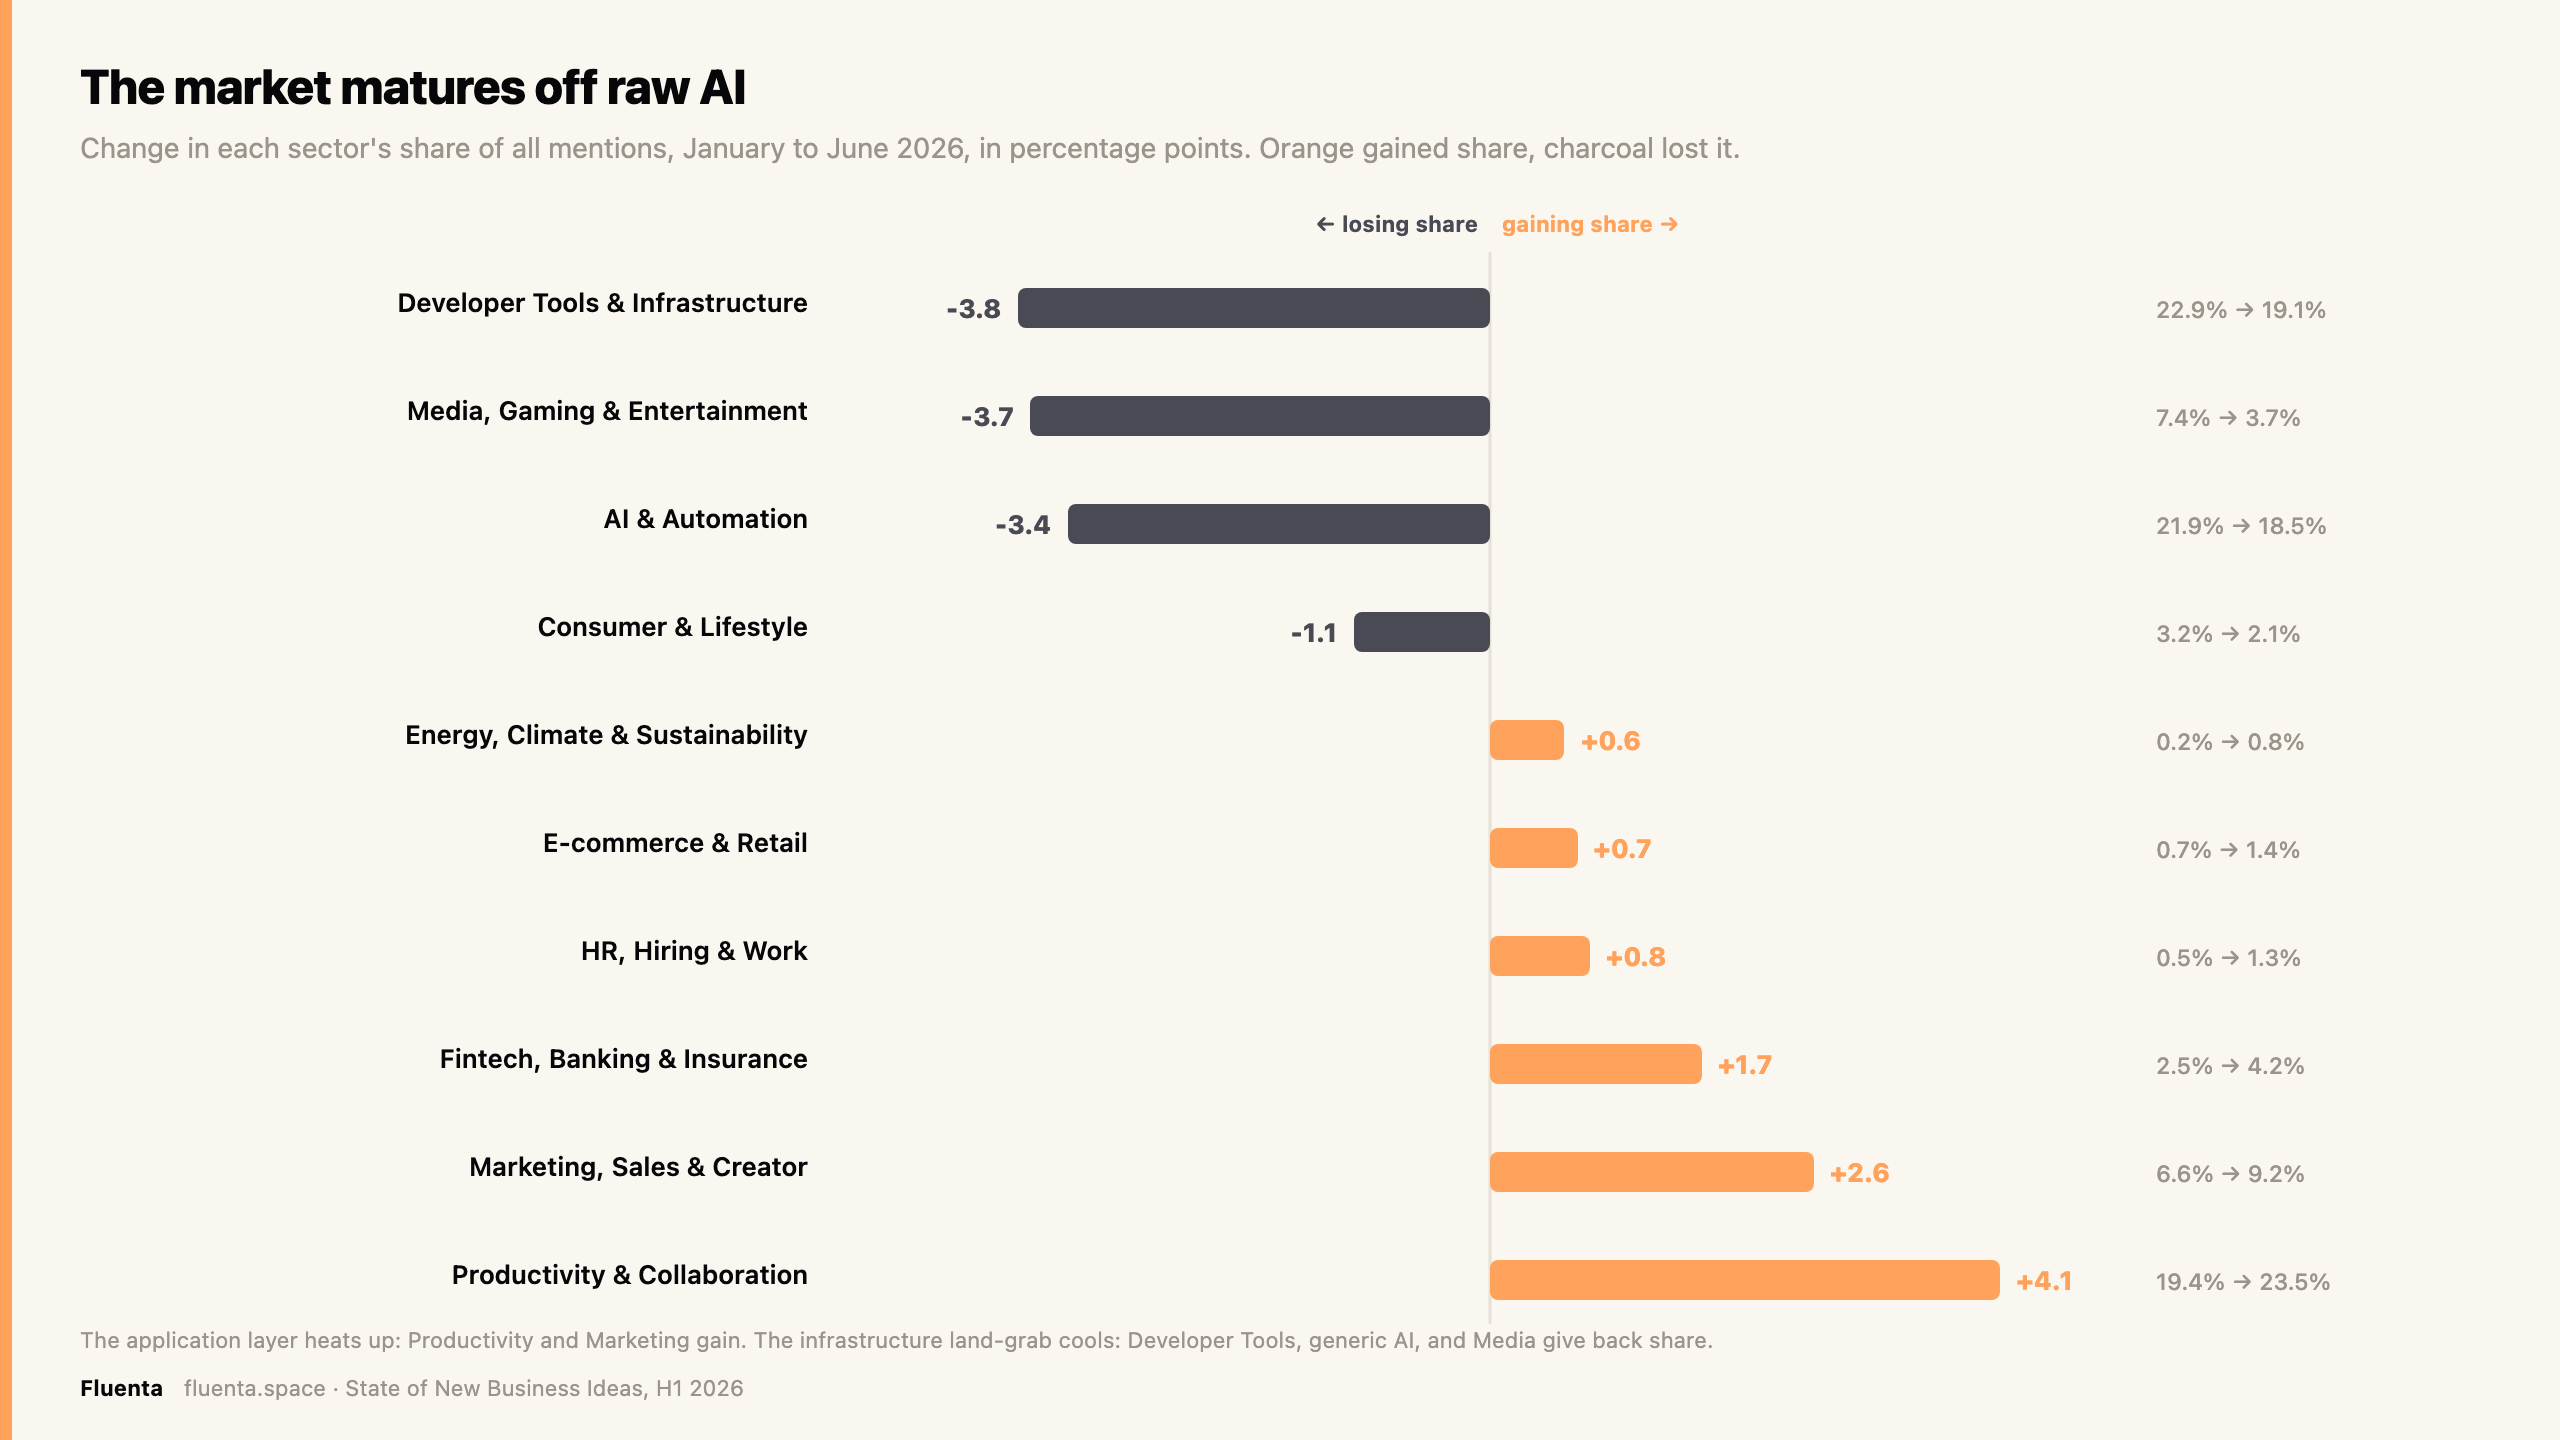
The direction is a maturation signal. Early in a platform shift, builders rush the infrastructure. As the shift settles, attention moves up the stack to applied products a non-technical buyer will pay for. H1 2026 is that hand-off in progress.
Seen month by month, the mix shifts steadily rather than in one jump.
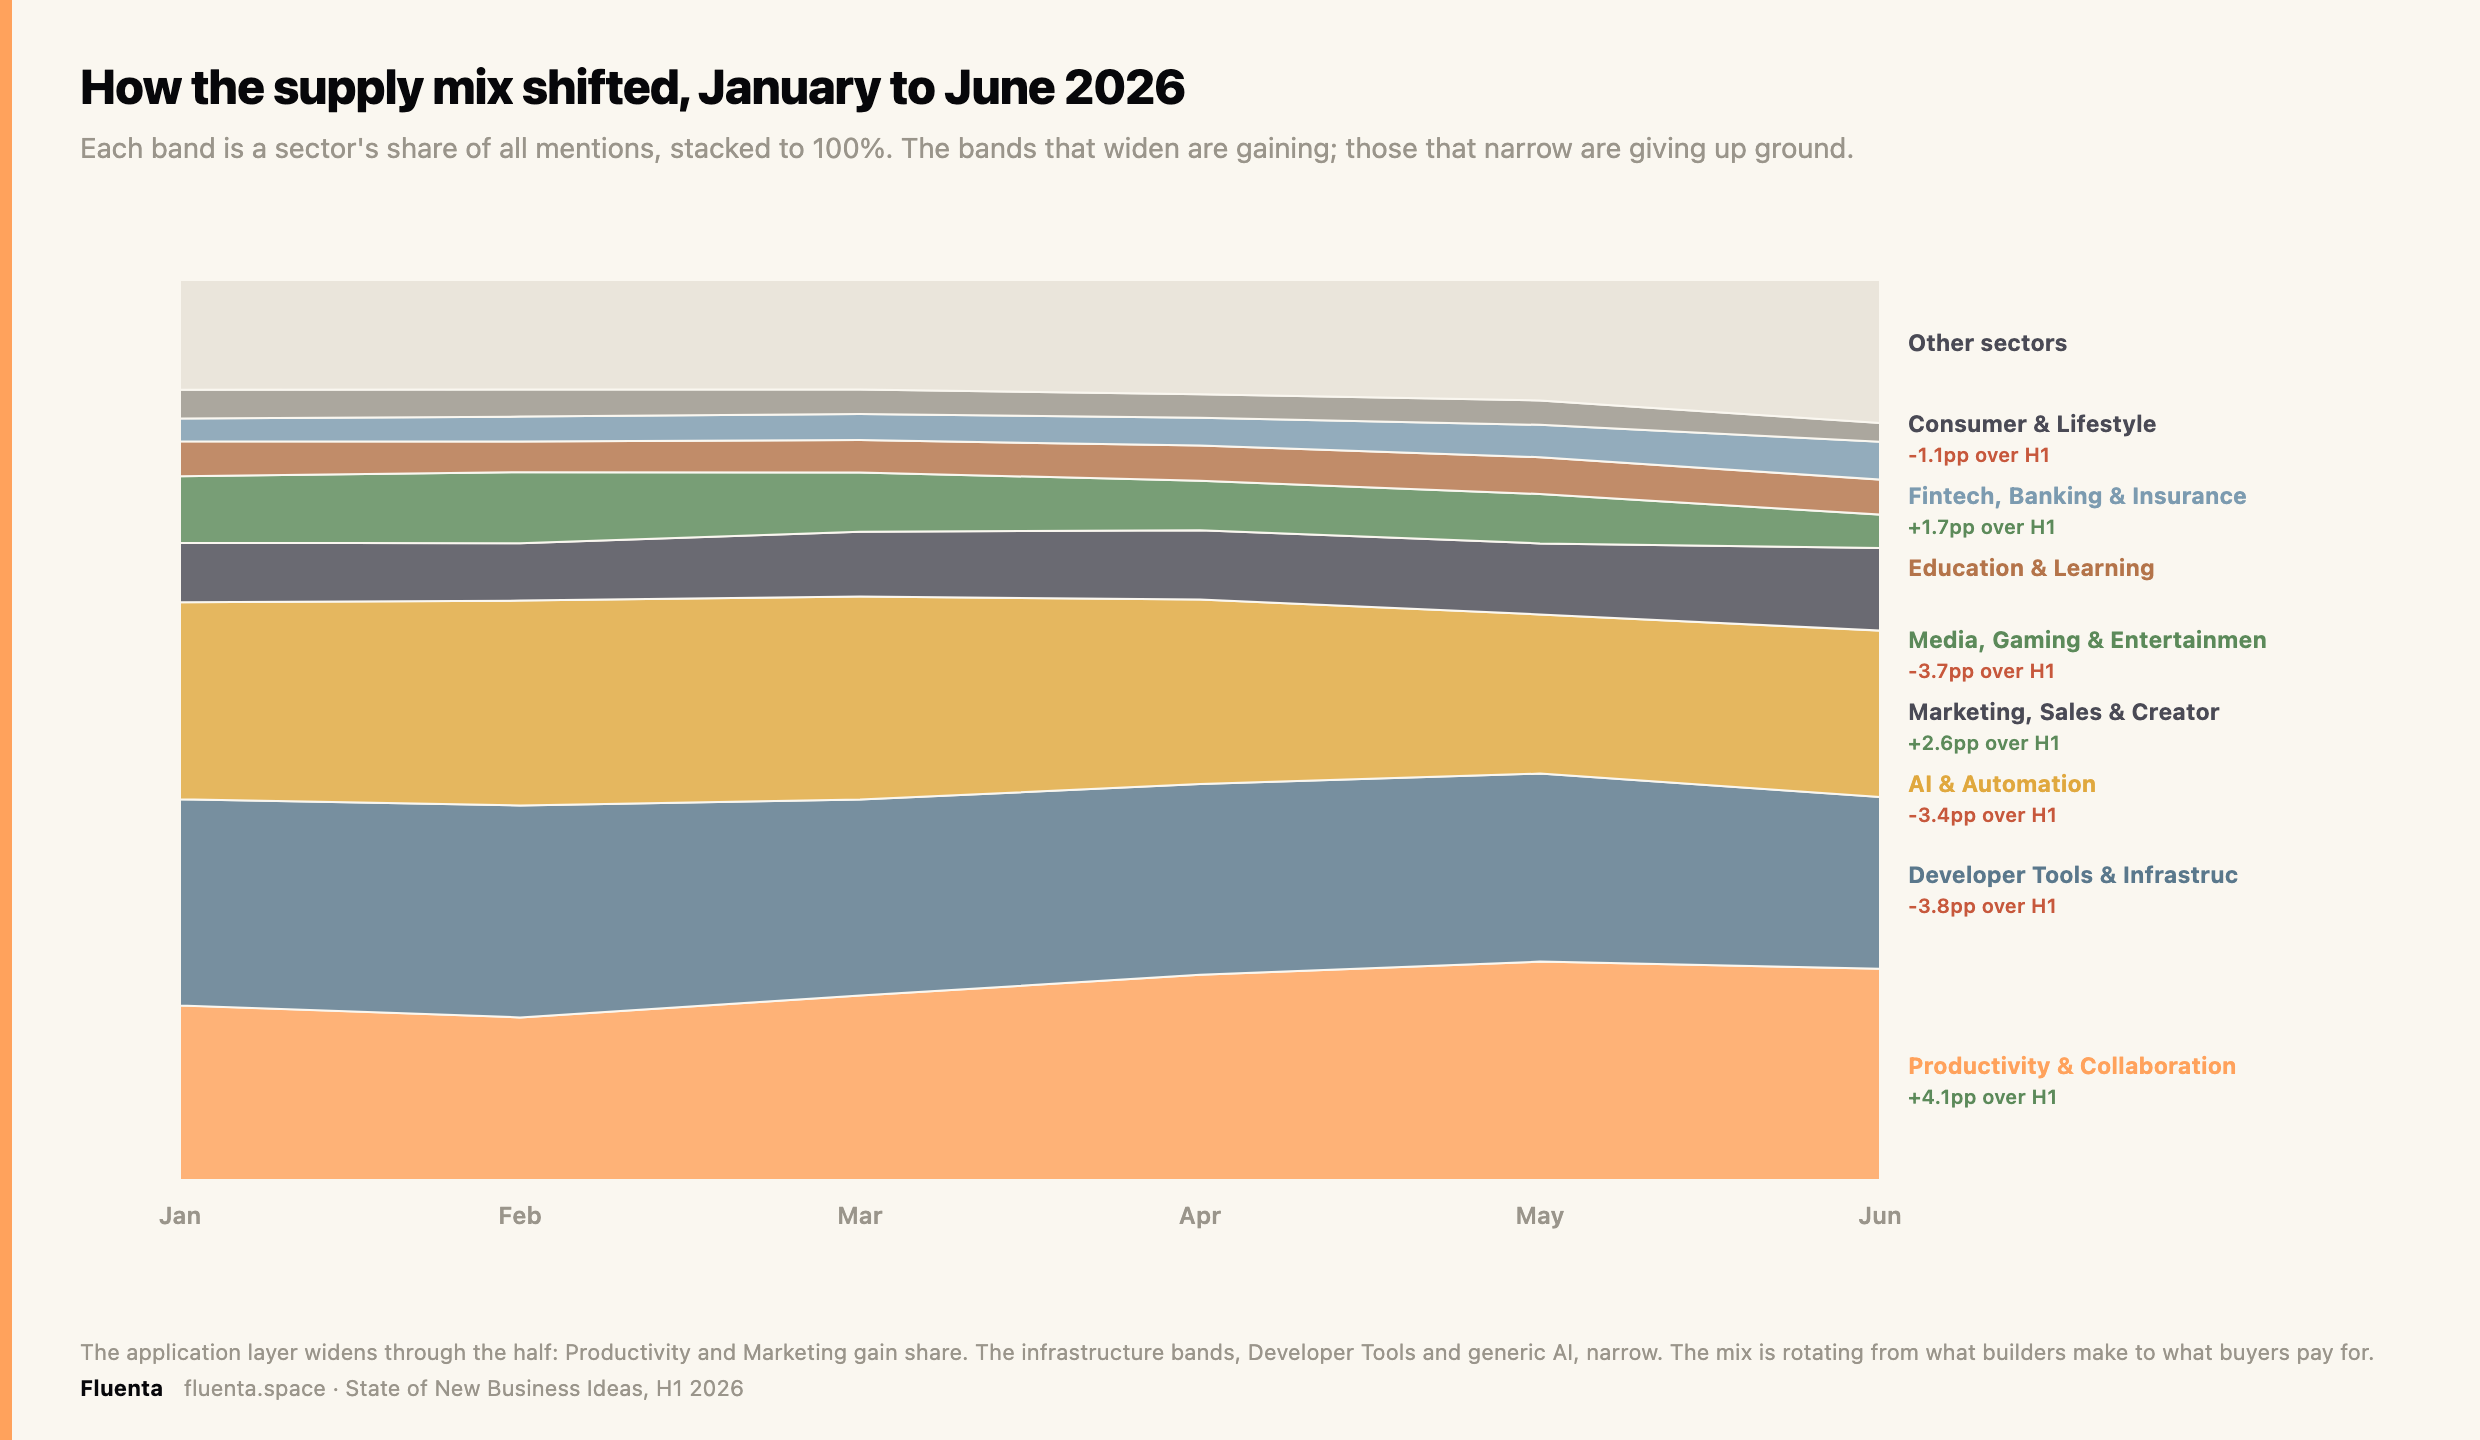
The Productivity and Marketing bands widen across the half while Developer Tools and generic AI narrow, the same rotation the change bars show, now as a continuous flow from what builders make to what buyers pay for.
Fads, stayers, and risers
Most launches never recur, but the language of the launches does. Tracking every two-word and three-word phrase across seven months separates the durable from the disposable.
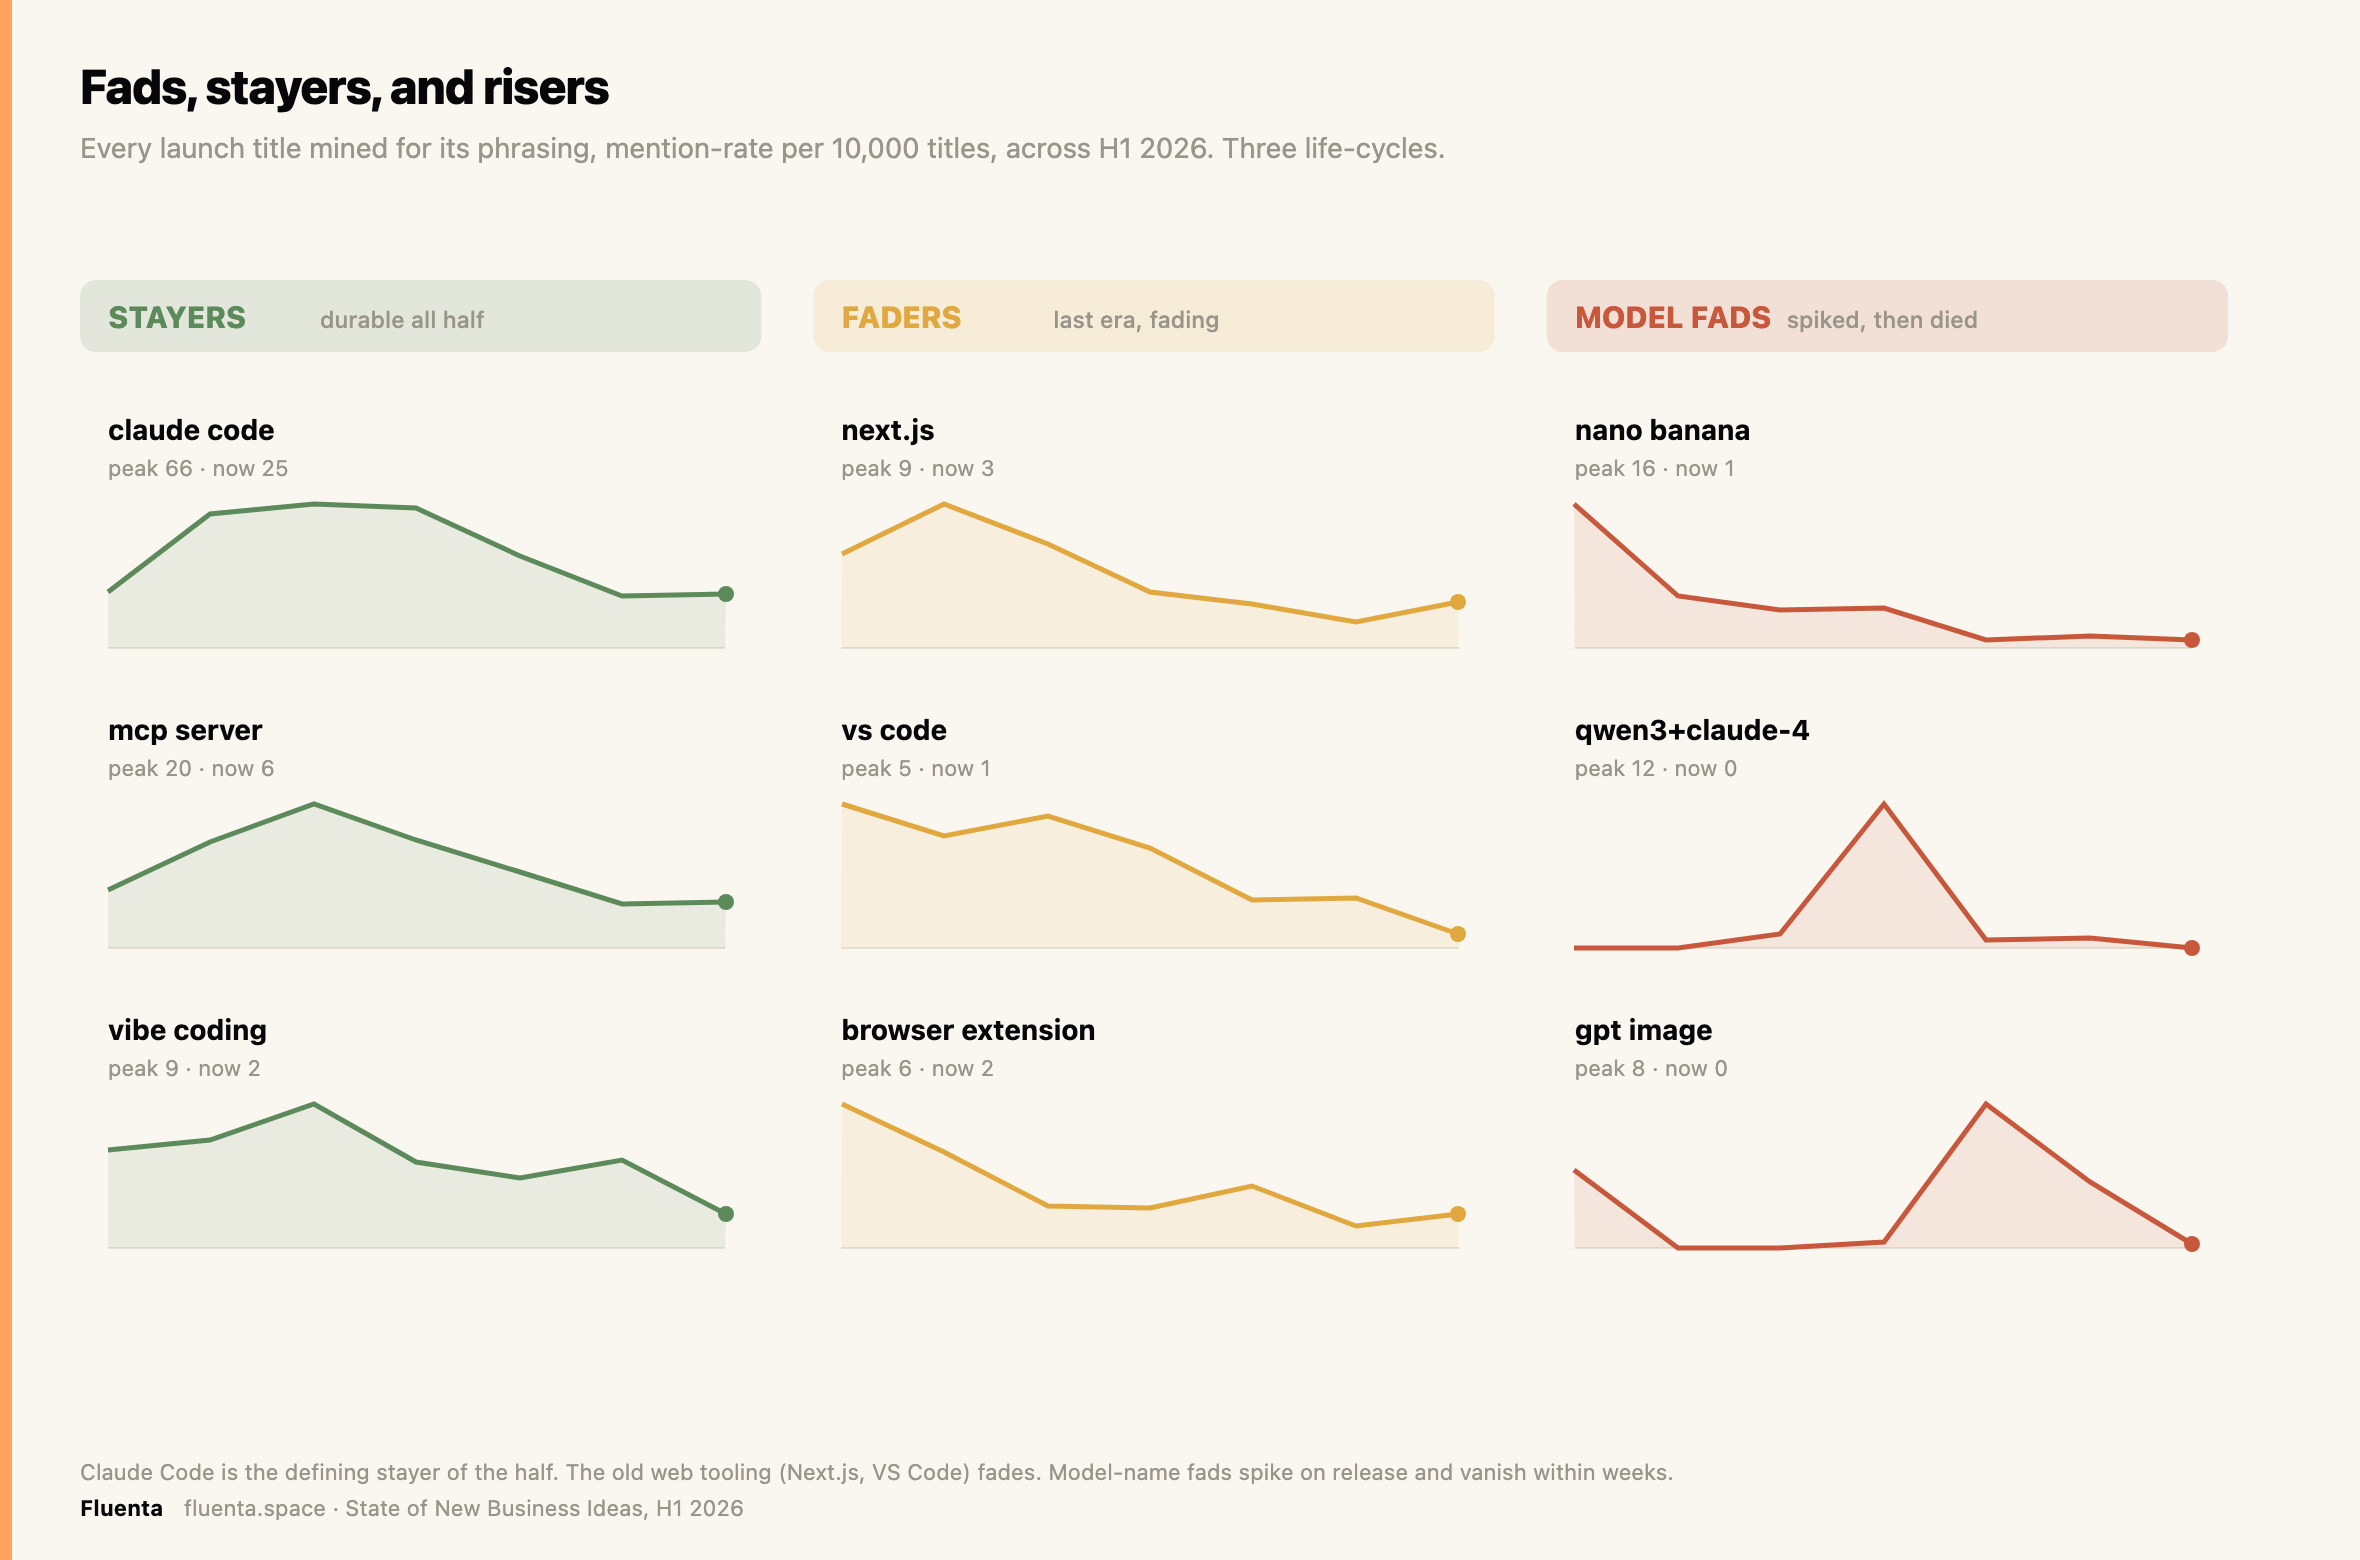
Claude Code is the defining stayer of the half-year and the most-mentioned phrase overall. The faders are the previous era's tooling losing ground: Next.js, VS Code, browser extensions. The fads are model-shaped and short-lived: nano banana spiked in December and died, a qwen and claude fine-tune wave crested in March, gpt image flared in April. Model-name fads spike on release and vanish within weeks.
The model-release pulse
Model releases and builder activity are usually tracked separately; this section reads them together, on the sources that cover the whole window.
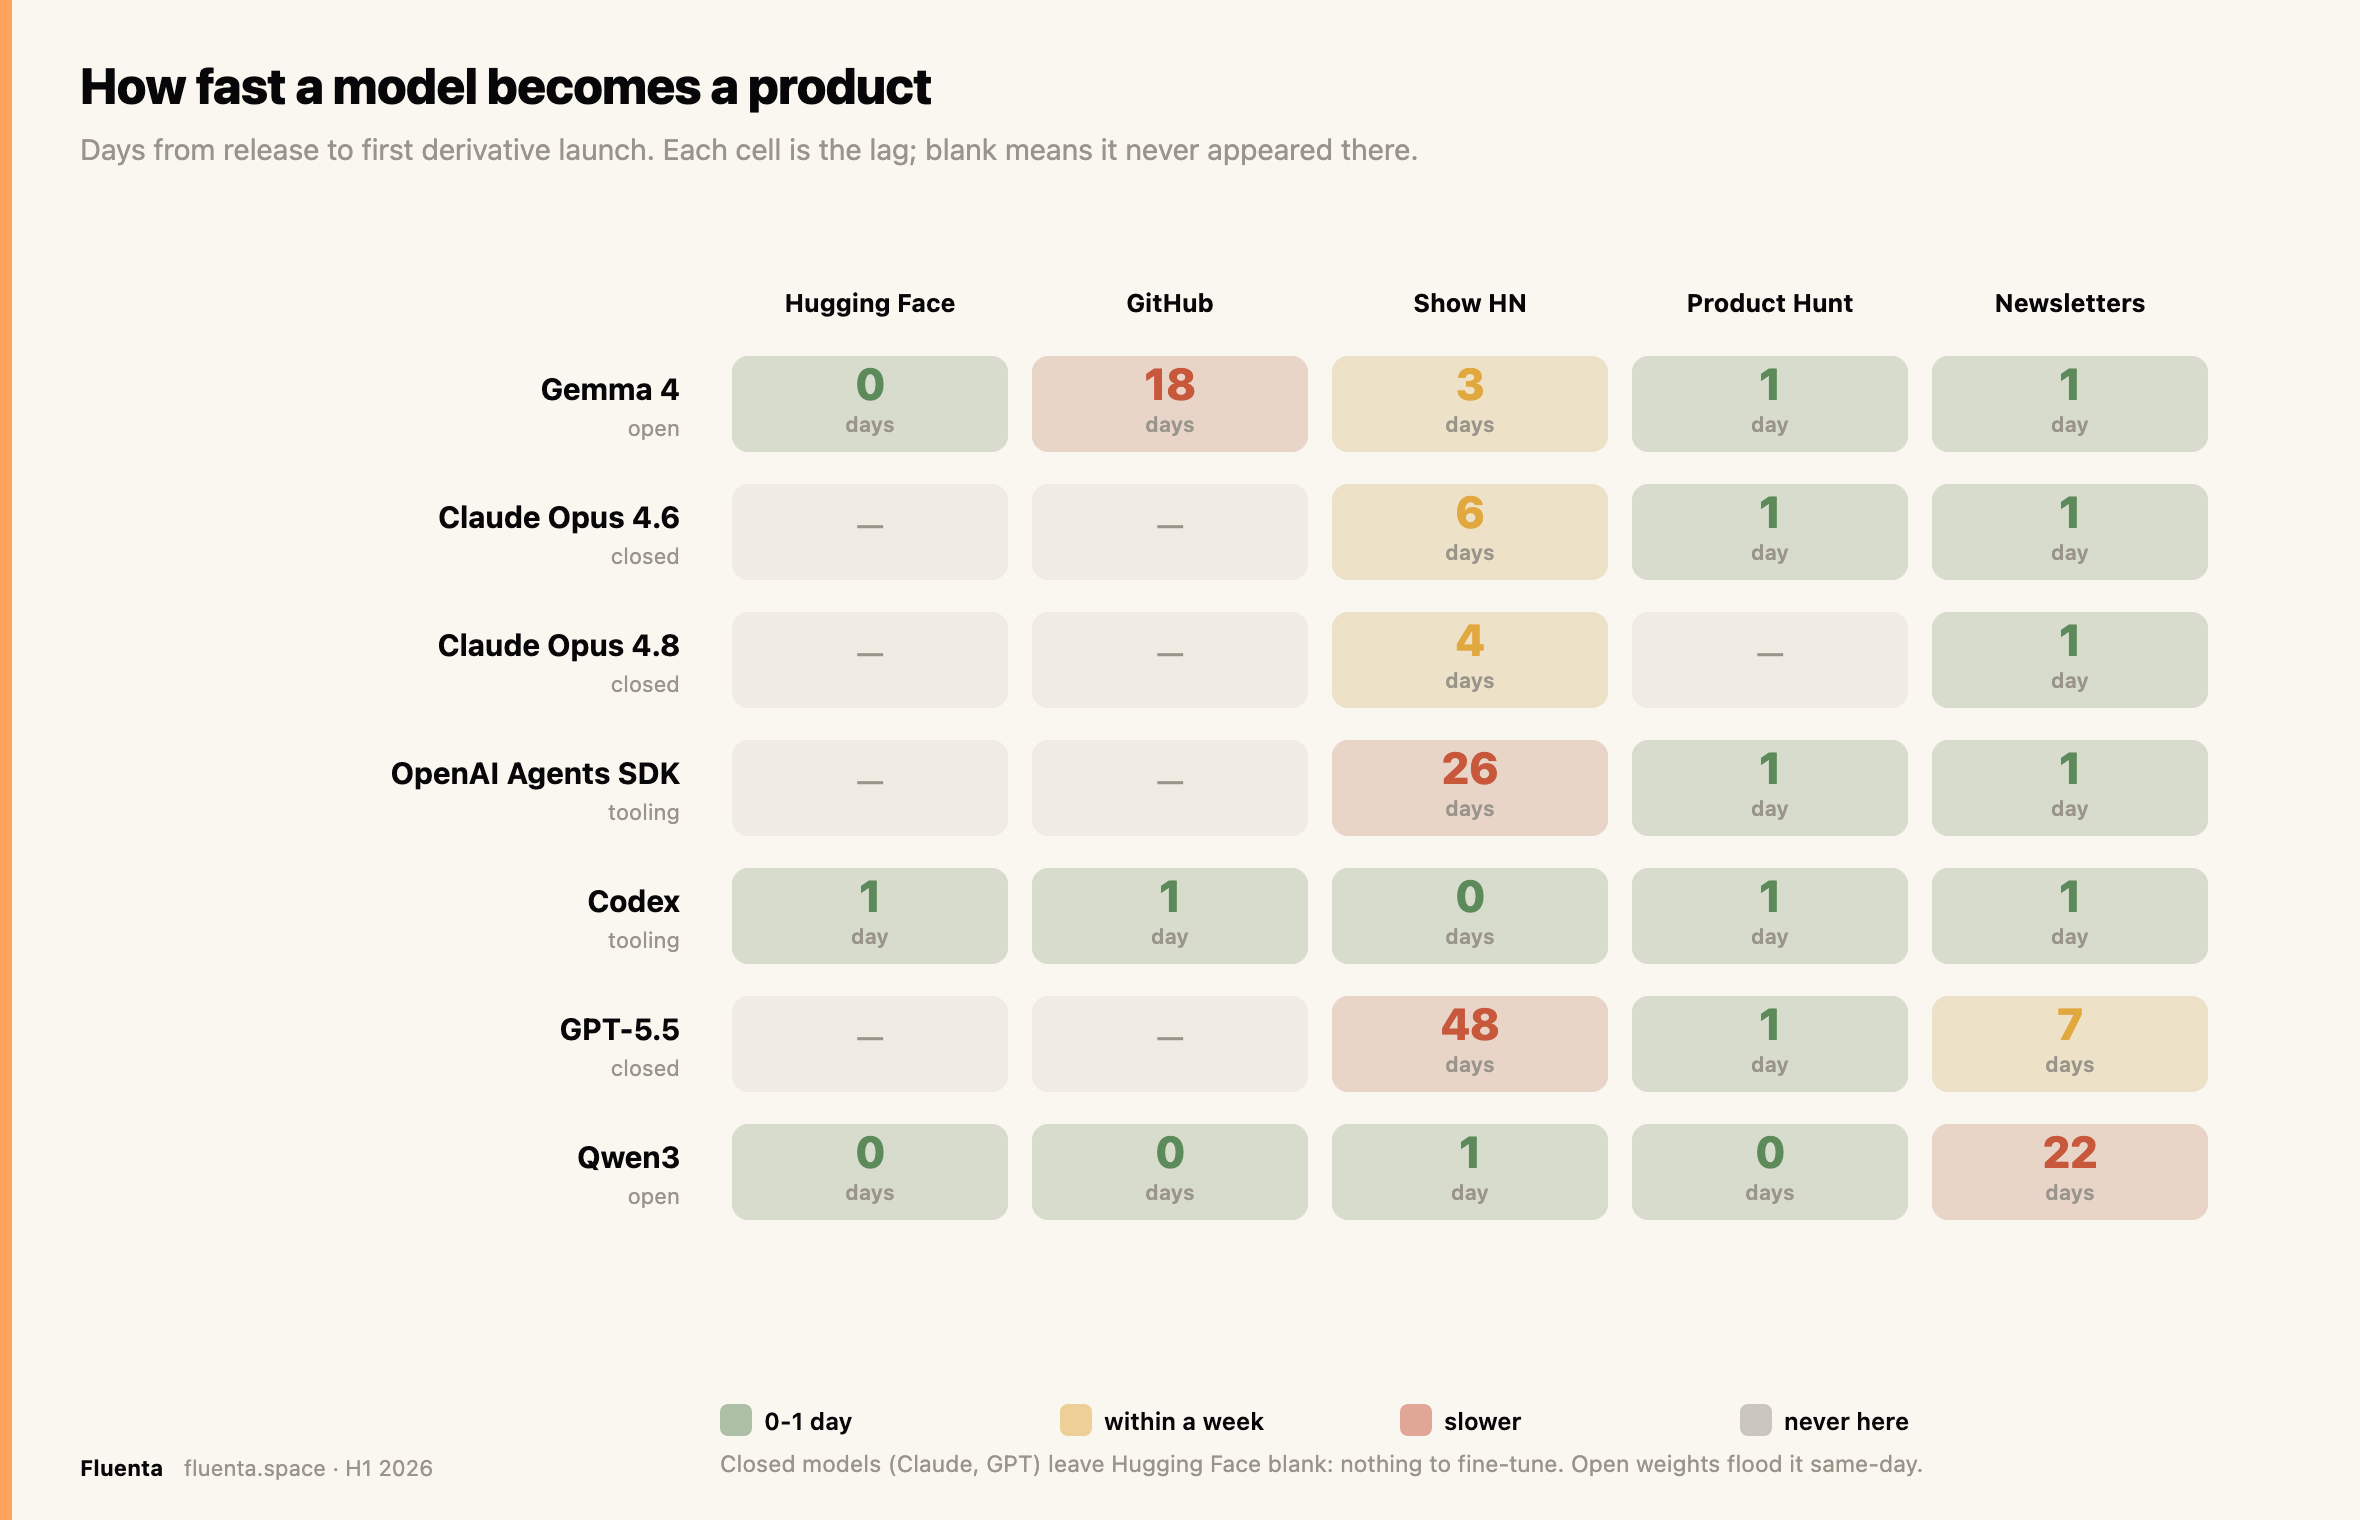
The lag from a model release to its first derivative launch has collapsed to days. Google's Gemma 4 produced a five-to-nine-fold surge and reached Hugging Face the same day it shipped. The structural finding is the split between open and closed: open-weight releases flood GitHub and Hugging Face because anyone can fine-tune them; closed models appear on launch platforms as wrappers but leave the model hubs empty. Anthropic is the exception that proves the rule, converting releases into sustained mindshare rather than release-day moments.
The releases did more than seed individual products; the release calendar itself tracked the idea market. Model releases accelerated sharply in February, and idea volume surged the month after.
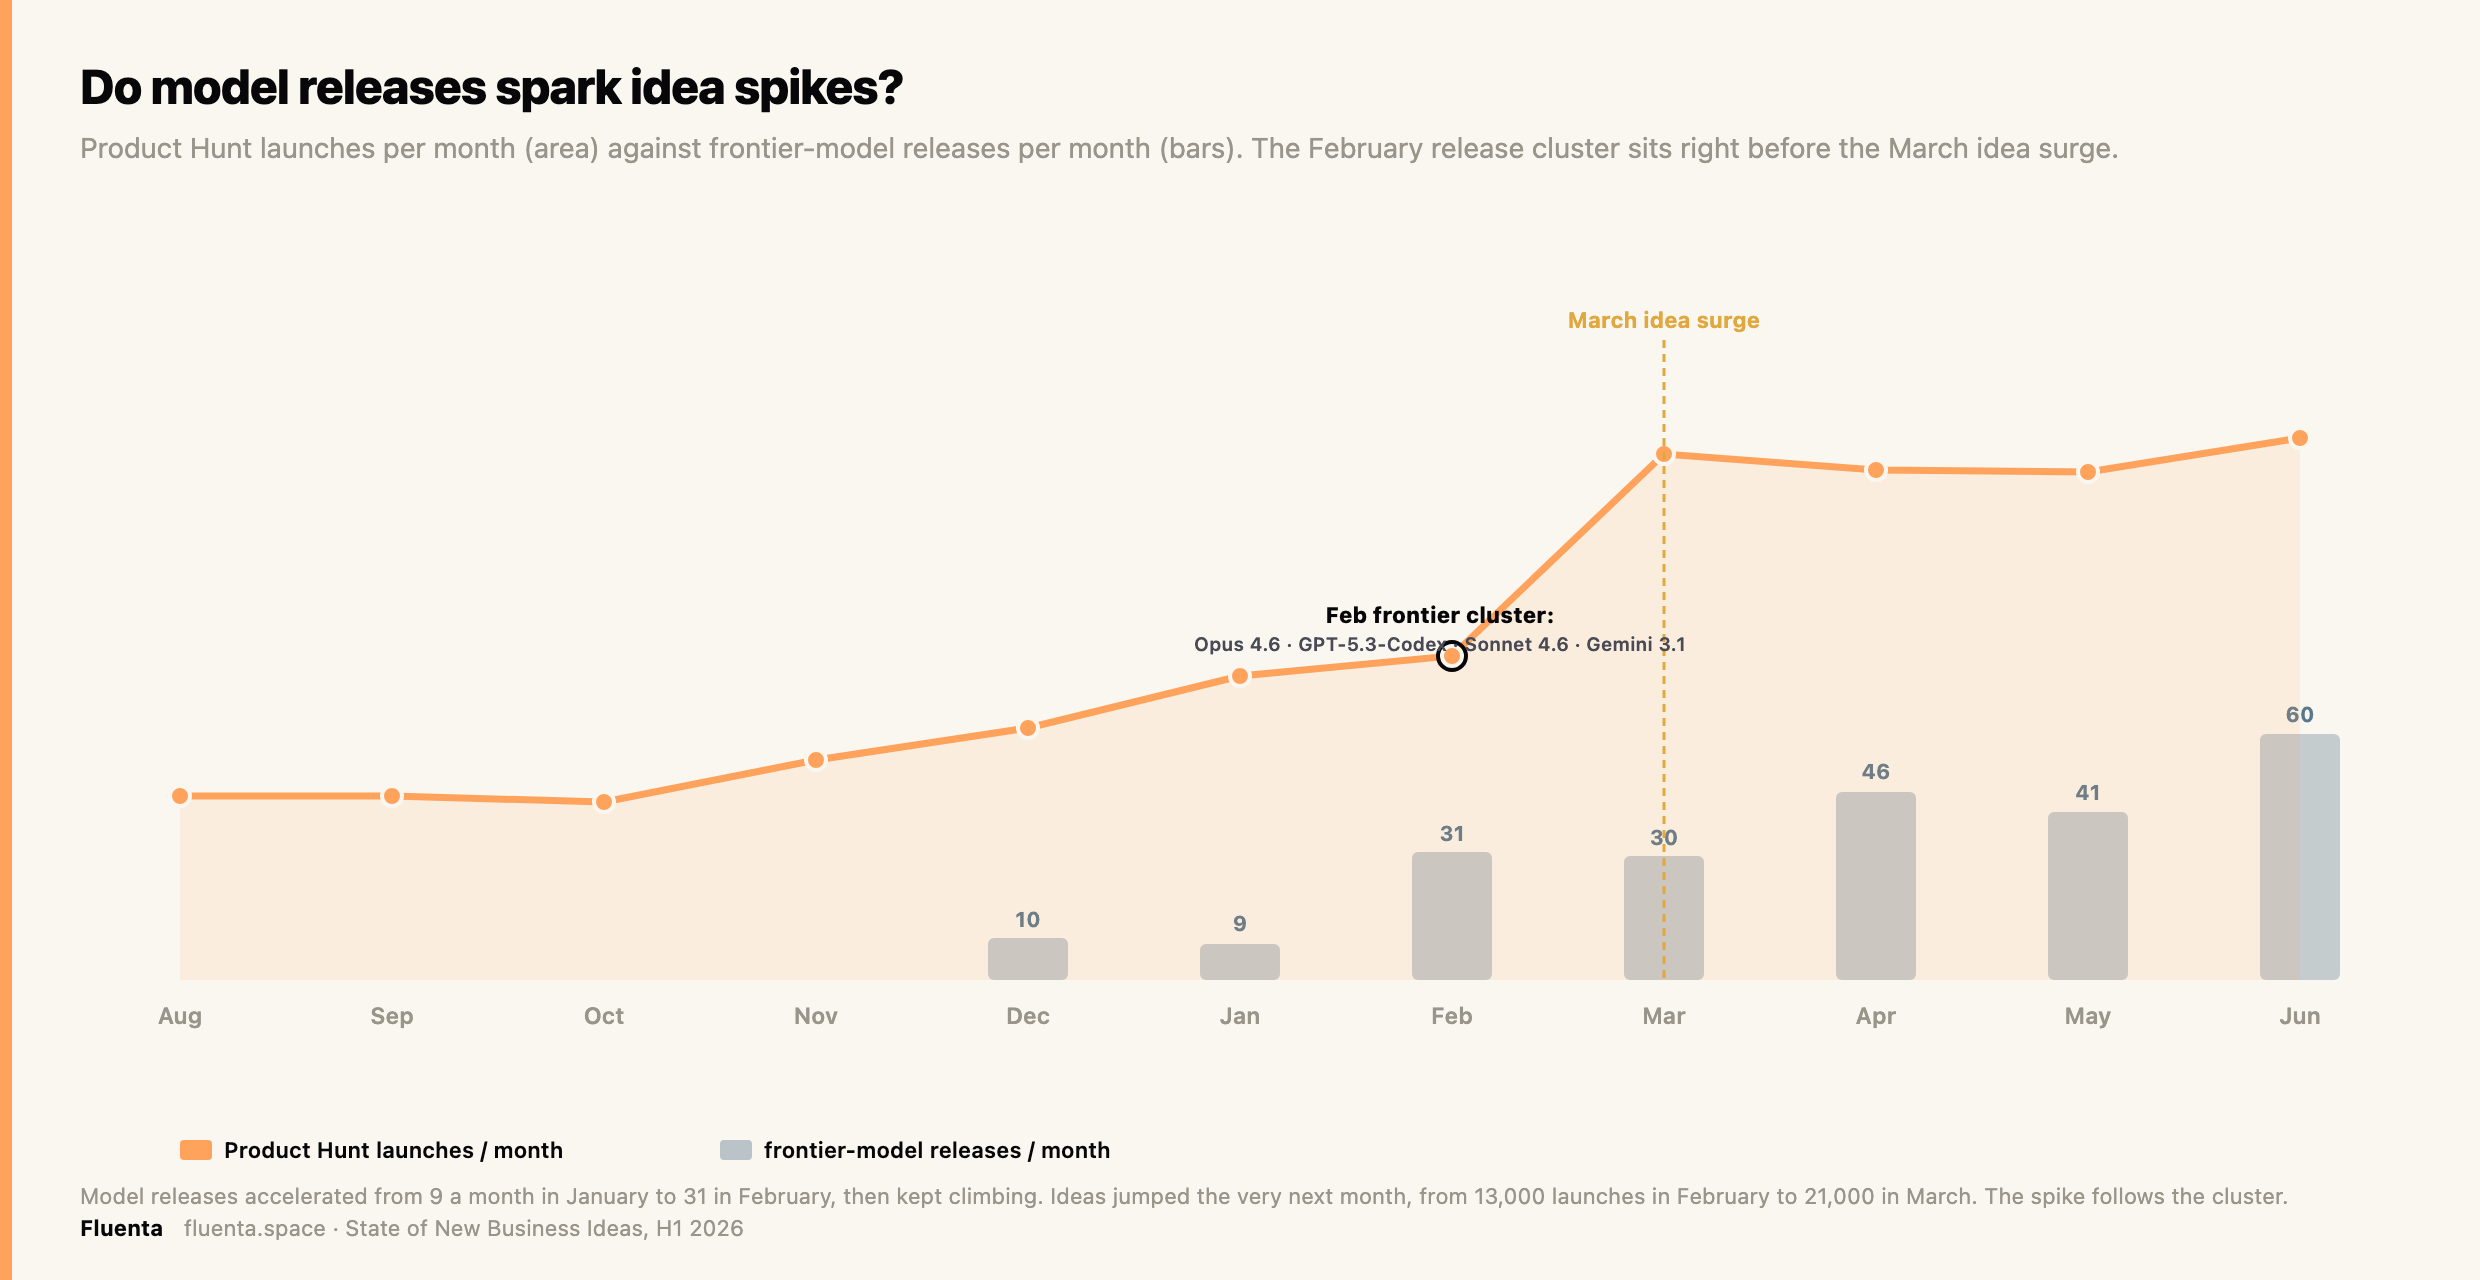
Correlation is not proof, and the launch platforms widen on their own over time. But the timing is hard to ignore: frontier-model releases climbed from nine in January to thirty-one in February, the month of the Claude Opus 4.6, GPT-5.3-Codex, Claude Sonnet 4.6, and Gemini 3.1 cluster, one month before the sharpest idea jump of the half.
How ideas travel, and why the money is always last
Ideas travel across sources, and the pattern only appears when they are matched morphologically, by concept rather than by name. Grouped into twenty-five named concepts, the flow is consistent.
The build layer moves as one. Community forums, AI model hubs, and launch platforms register a concept within the same week. Media coverage trails by roughly five weeks. Venture and accelerator attention trails by roughly six.
Builders move in a week. The press catches up in five. The money arrives in six.
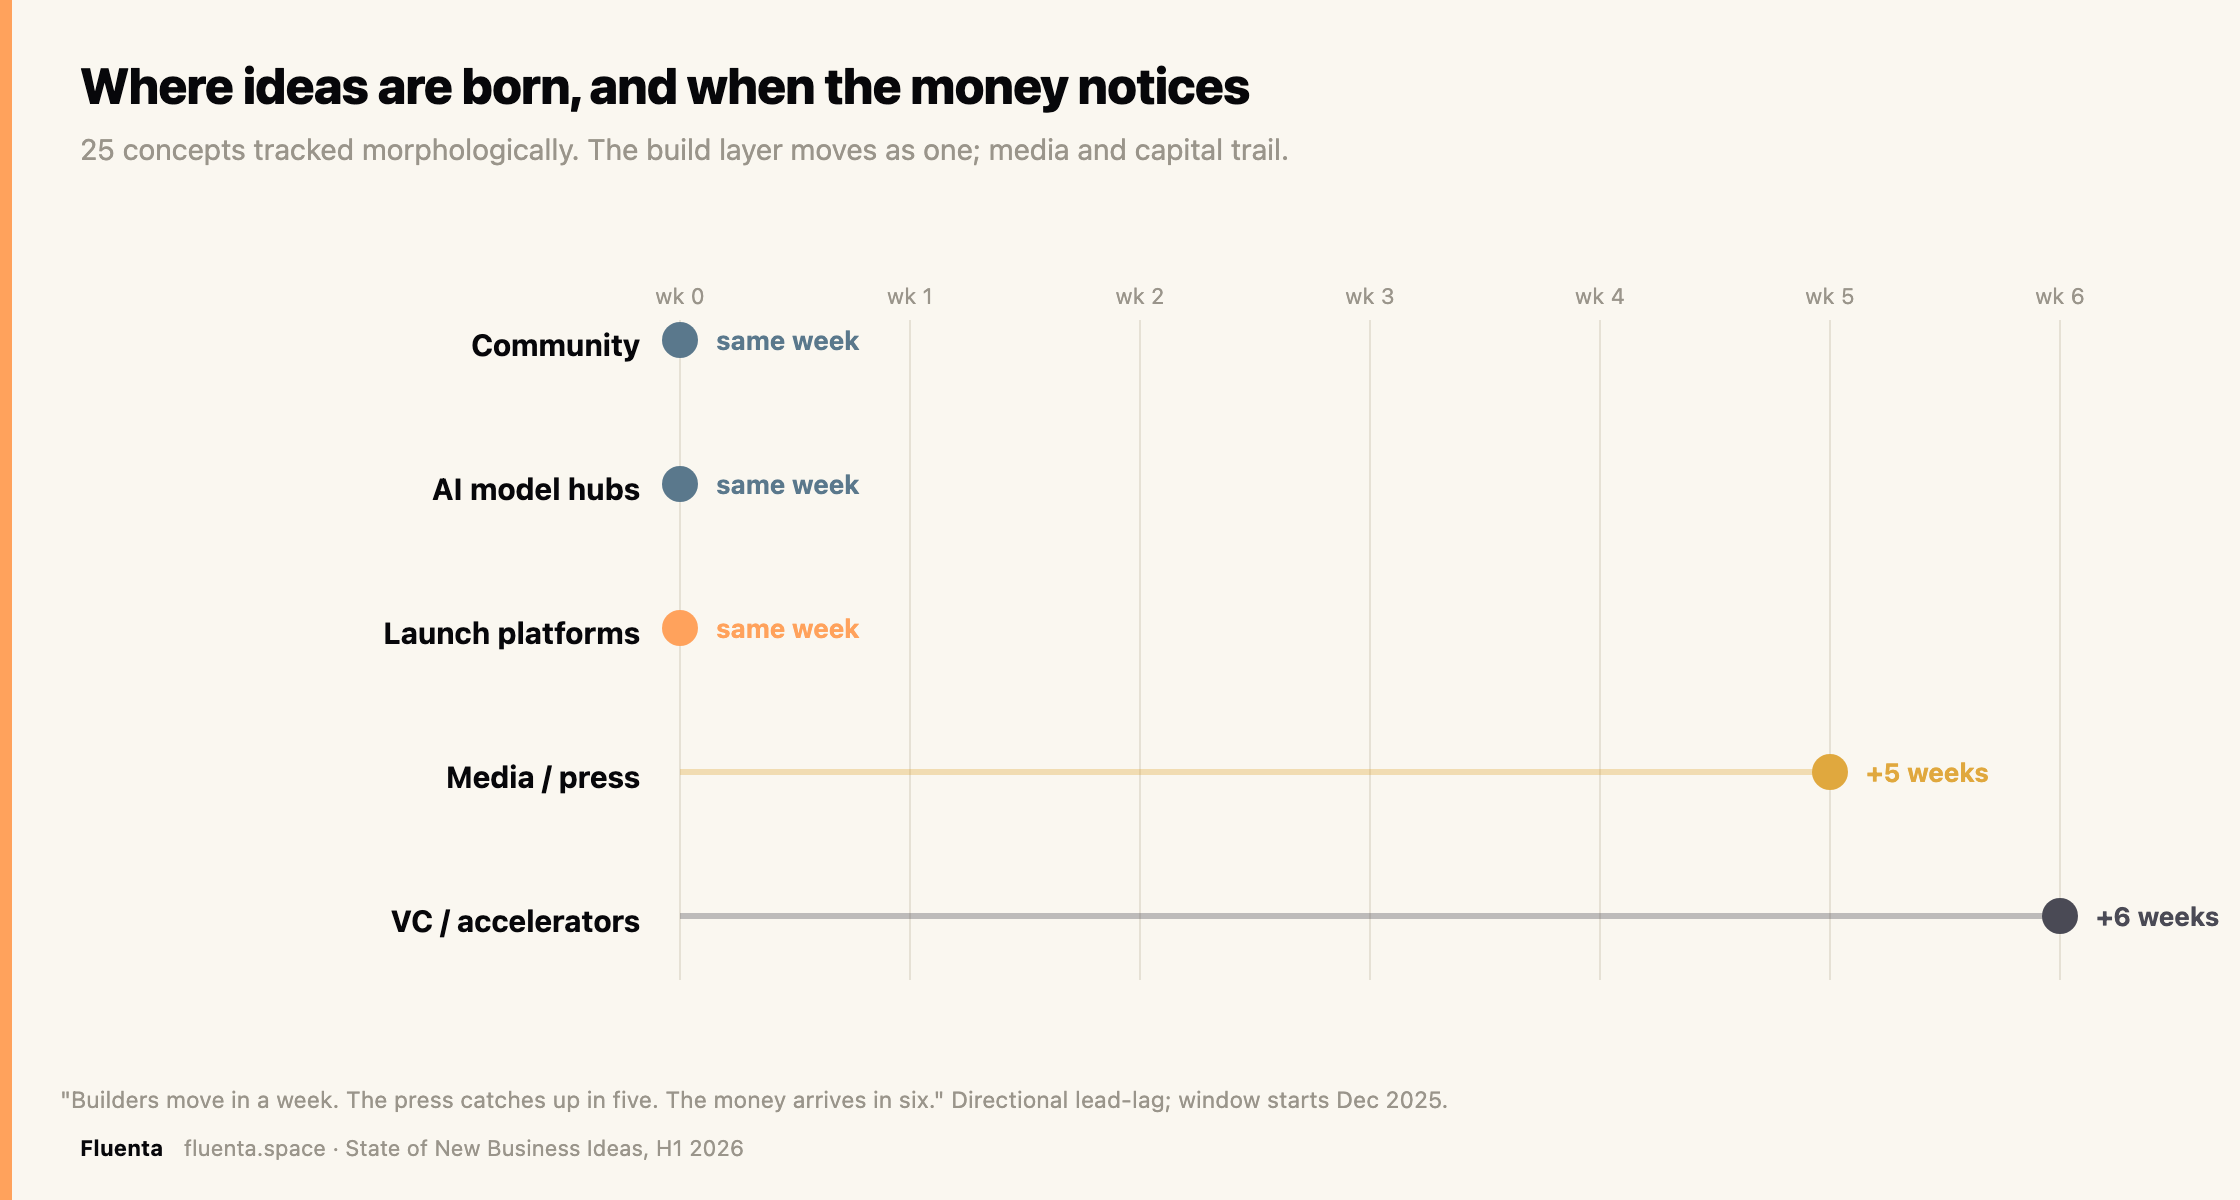
By the time a concept is in the headlines, it has been shipping for over a month, and by the time capital notices, the window has been open for six weeks.
Which ideas rose, and which faded
Tracked morphologically, by concept rather than by name, the twenty-five most recurring ideas split cleanly into risers and faders across the half.
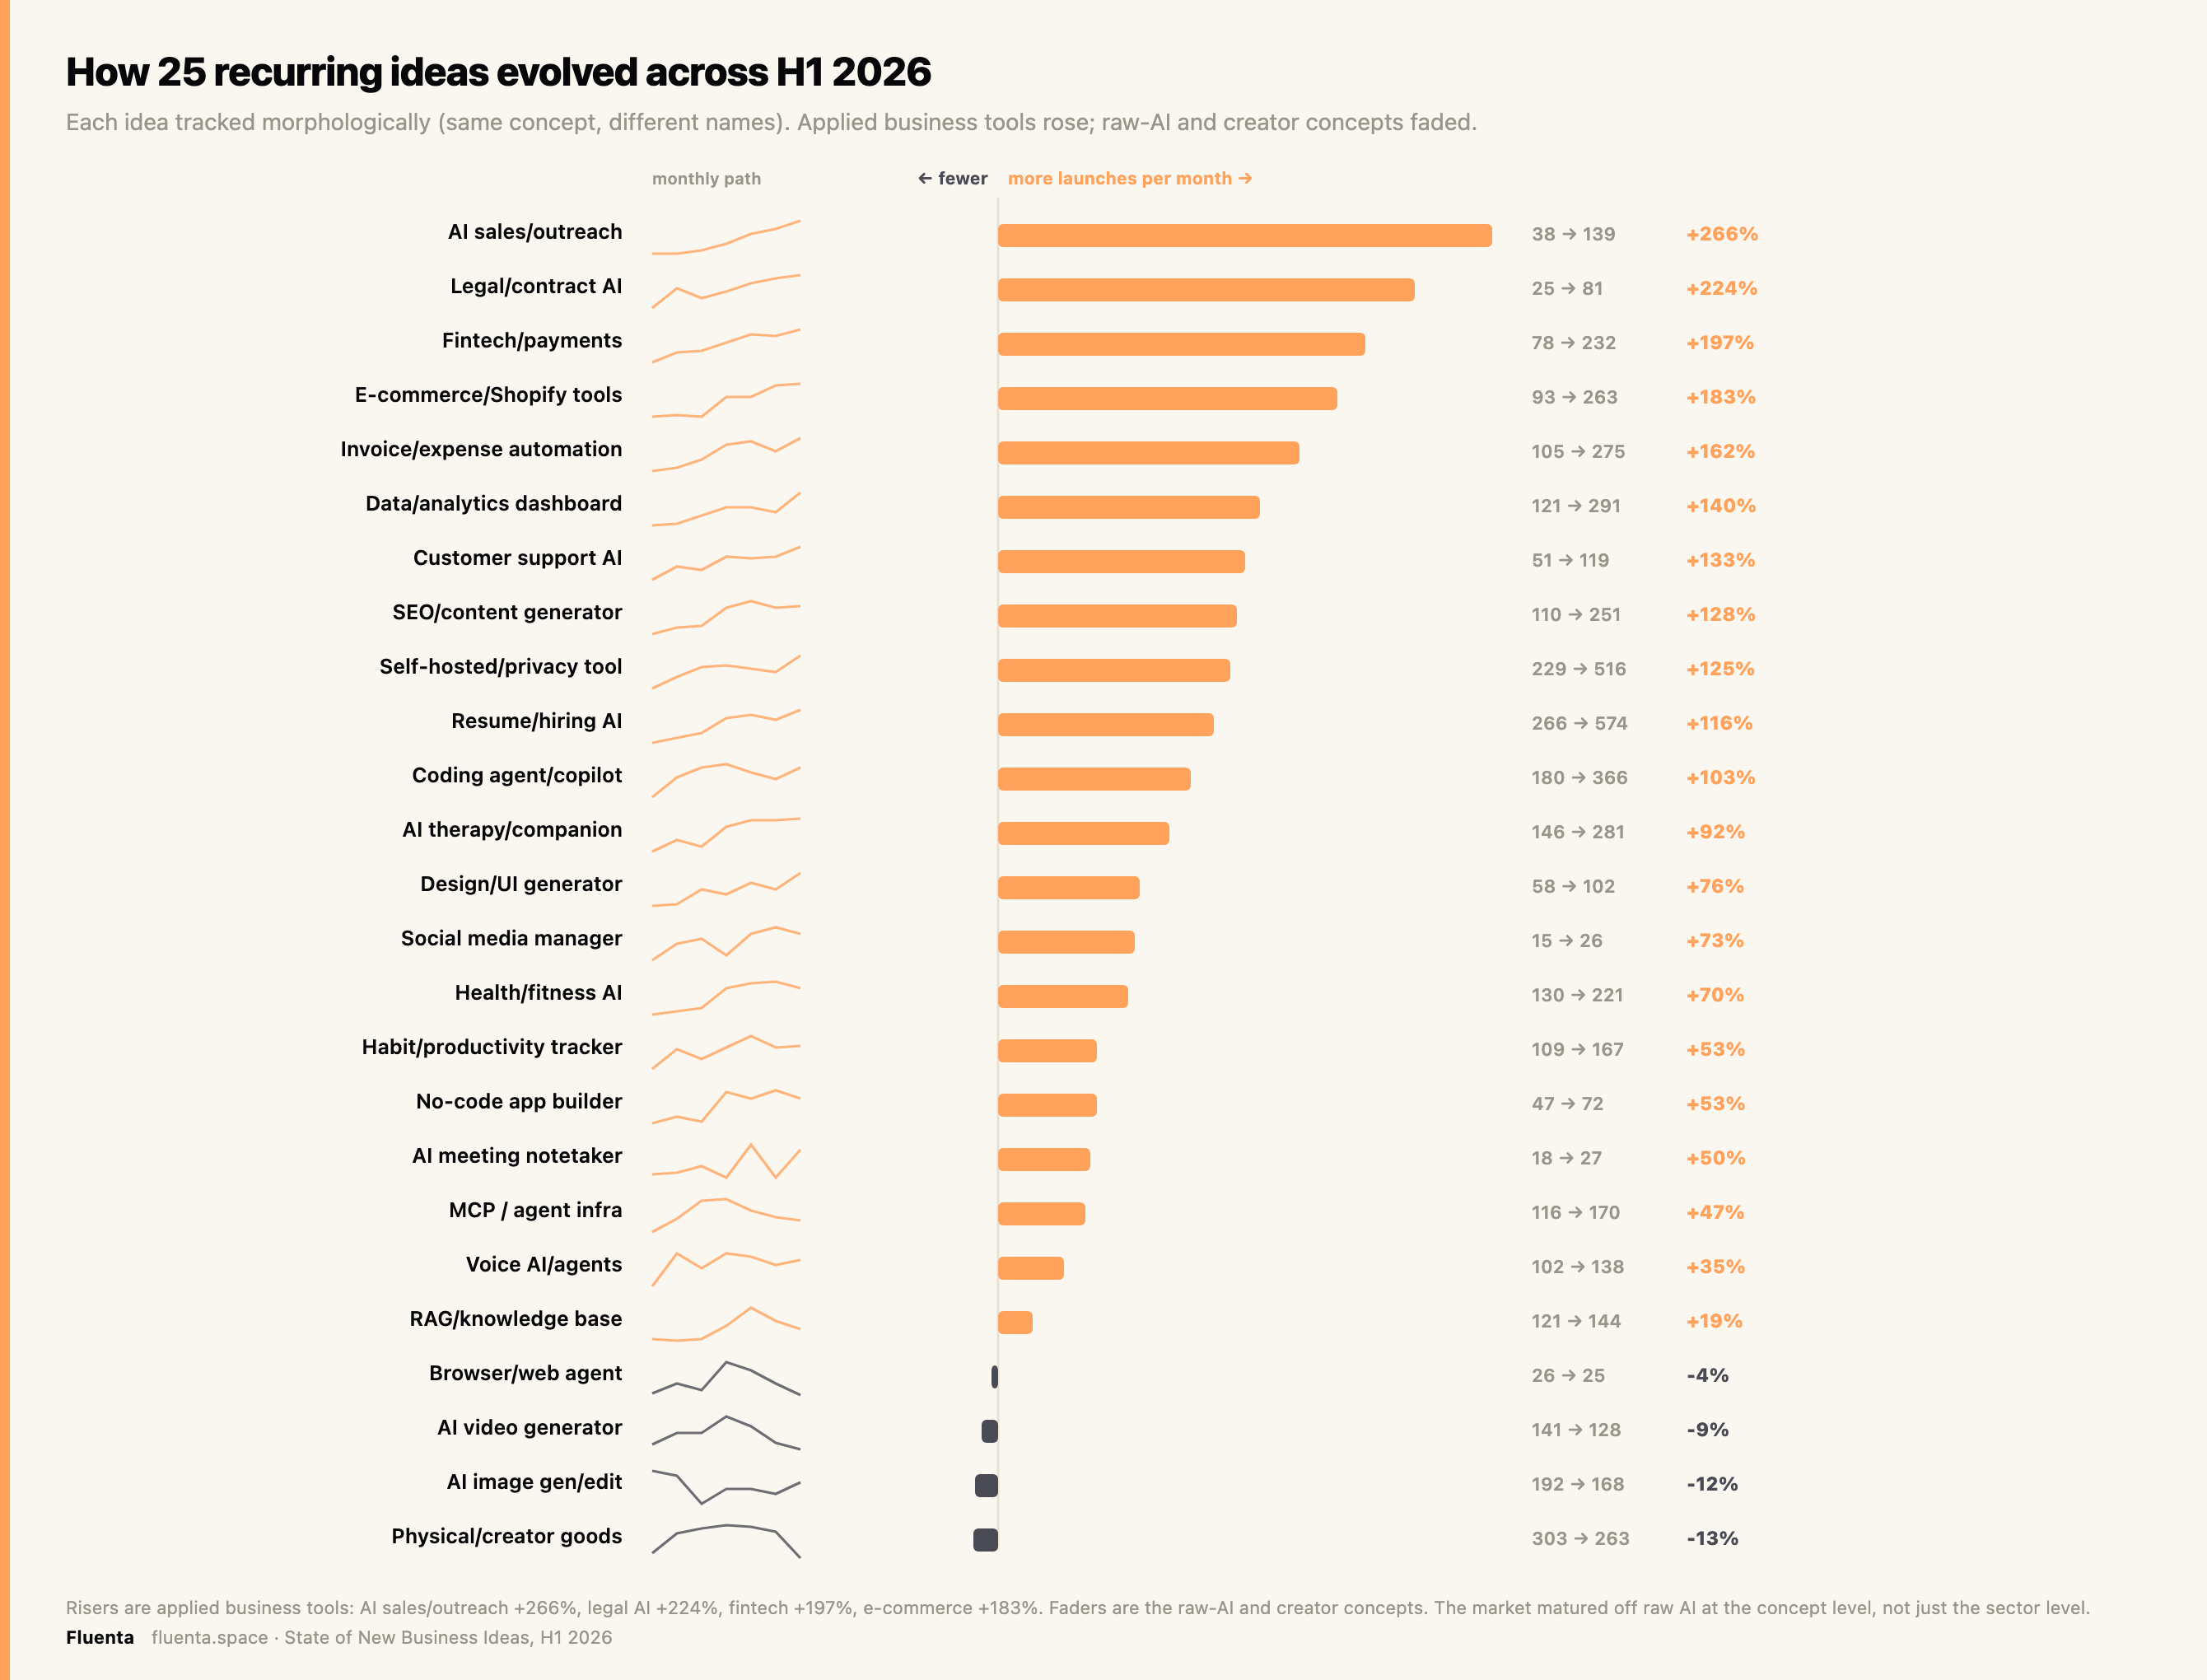
The pattern repeats the sector story at a finer grain. The concepts that grew fastest are applied business tools with an obvious buyer: AI sales and outreach rose 266 percent from December to June, legal and contract AI 224 percent, fintech and payments 197 percent, e-commerce tooling 183 percent, and invoice and expense automation 162 percent. The concepts that faded are the raw-AI and creator plays: physical and creator goods fell 13 percent, AI image generators 12 percent, AI video generators 9 percent, and the MCP and agent-infrastructure wave peaked in March before giving back ground. The market did not just rotate between sectors; the underlying ideas themselves matured off raw AI and toward software a business will pay for.
The scored picture, and what separates a winner
Volume says what got built. Scoring says what was worth building. Across 1,238 ideas scored over four months, the comparable Launch Readiness average held steady, from 59.9 in March to 58.2 in June.
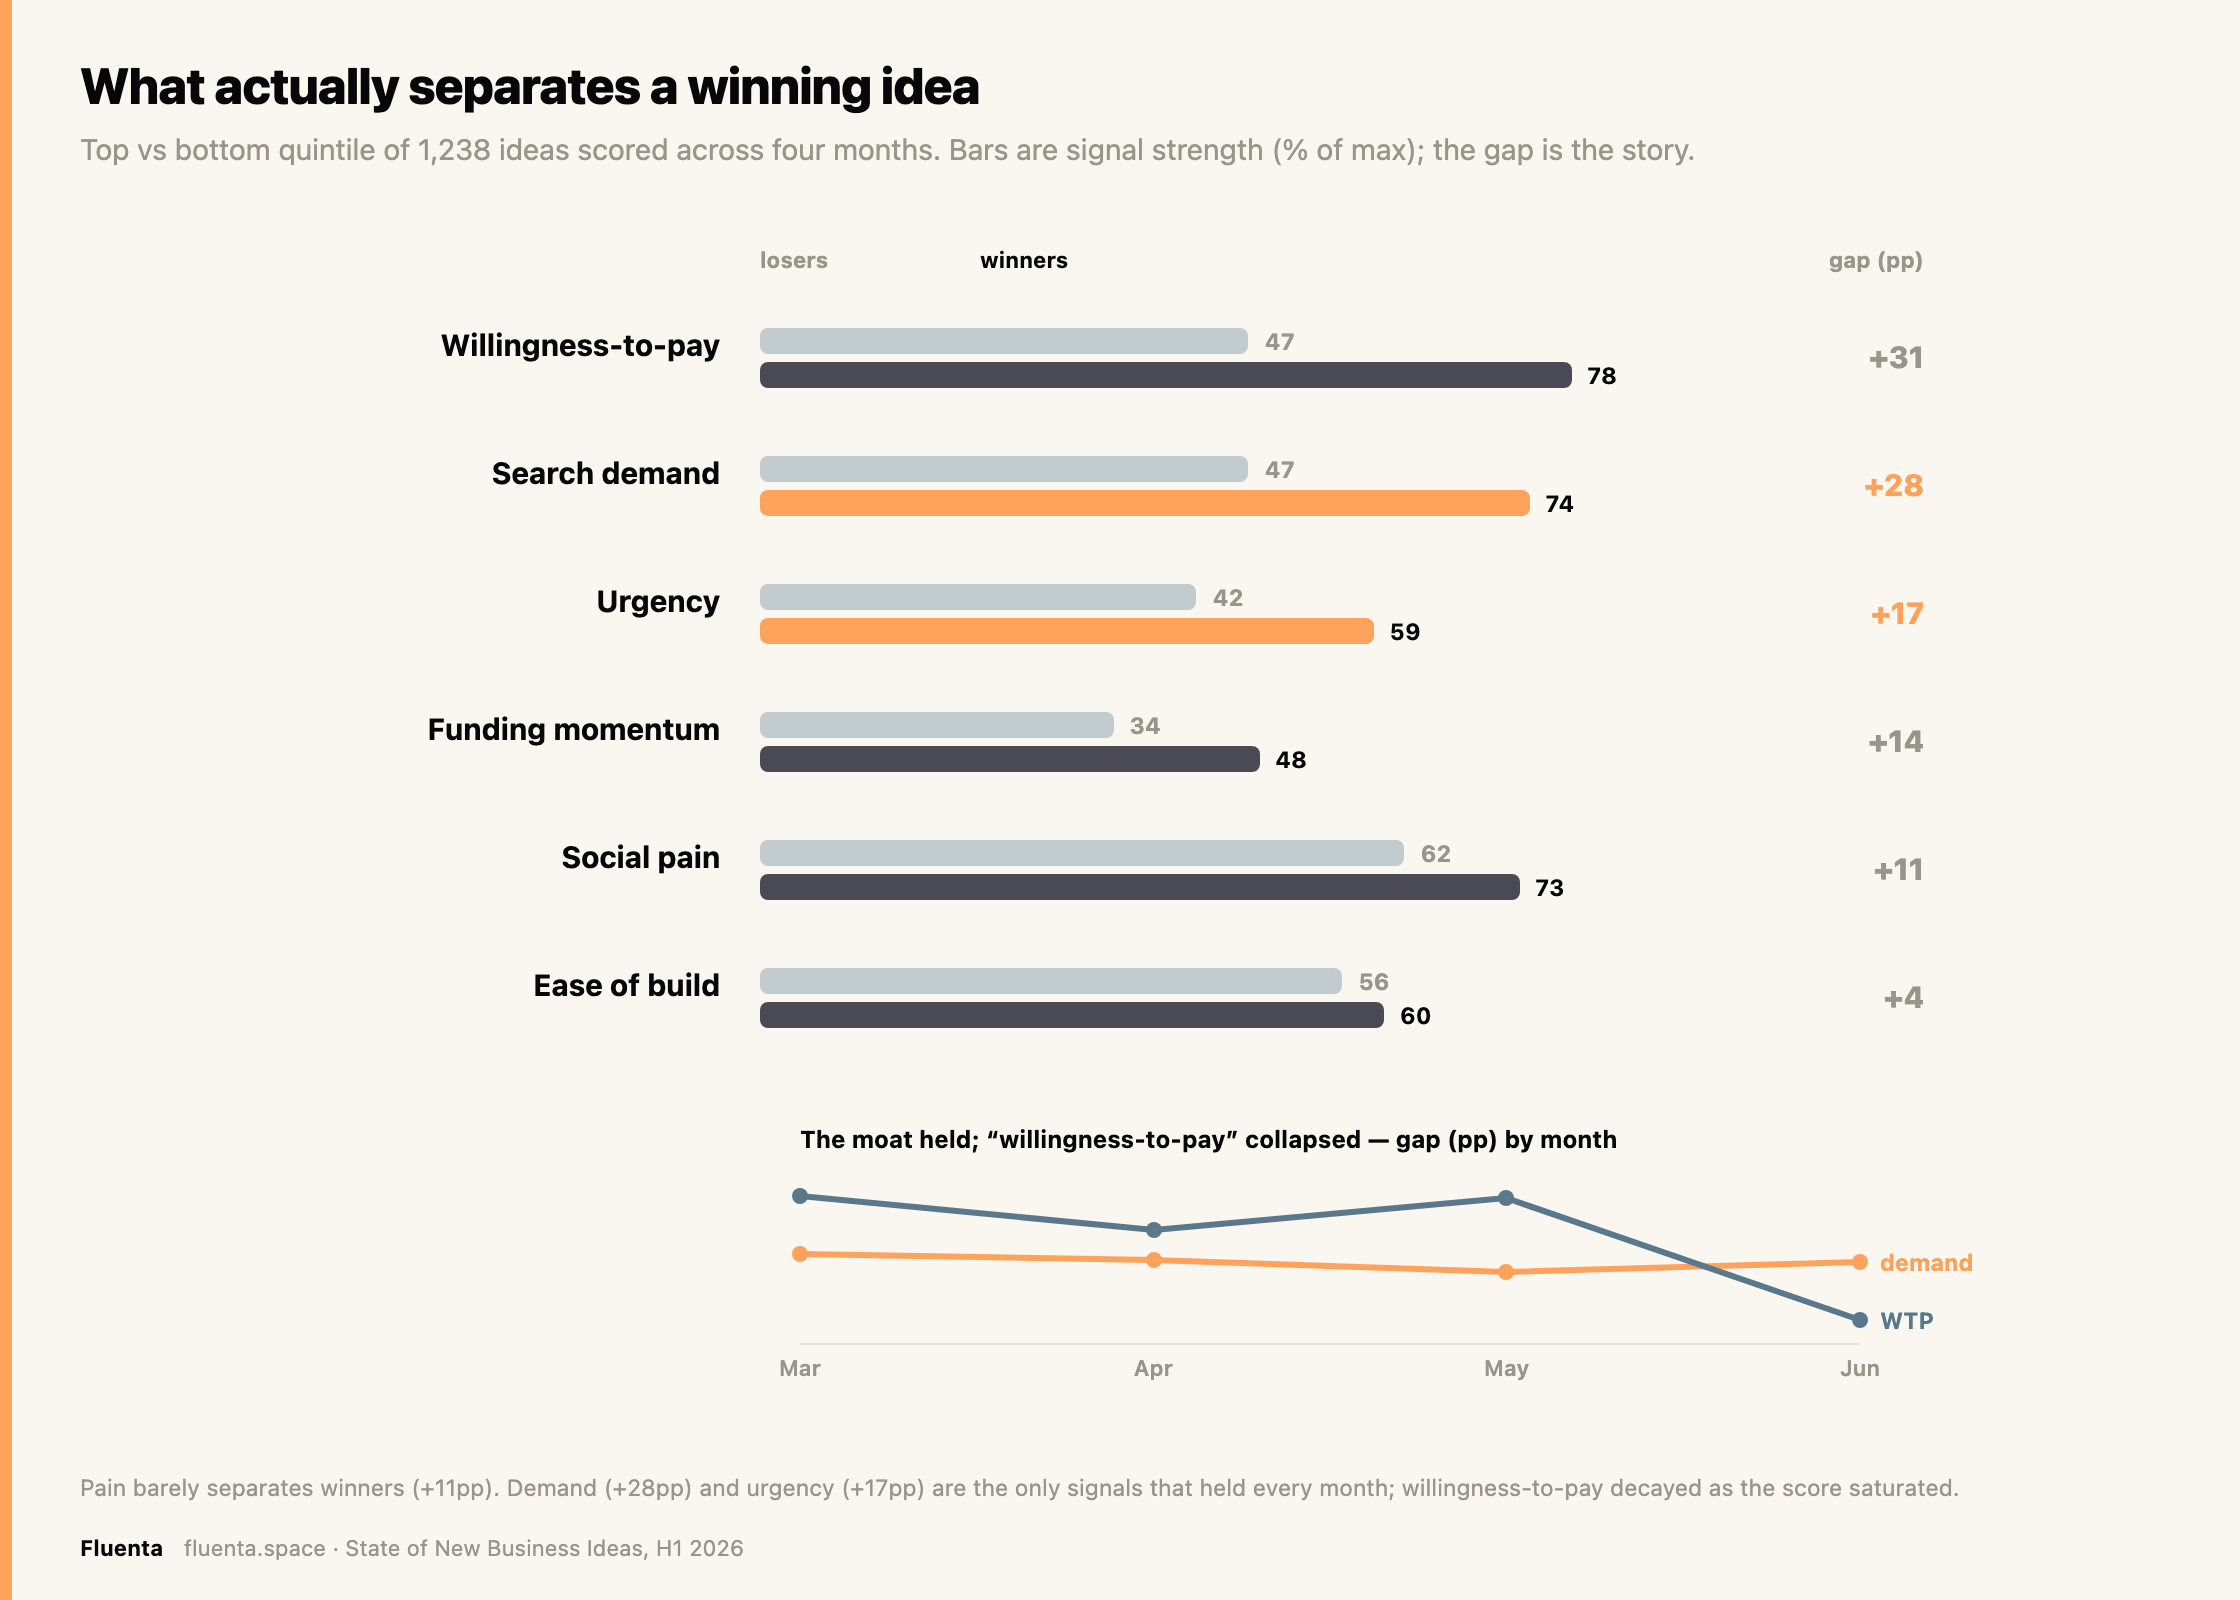
One signal holds every month. Comparing the top fifth of ideas to the bottom fifth, search demand separates them by about 28 points in March, April, May, and June alike. Urgency adds another 17. Pain moves the needle by only 11: nearly everyone claims a burning problem. Willingness-to-pay looked like the whole story through May, separating winners from losers by around 50 points, then collapsed to 8 by June as the payment signal saturated. The durable lesson is proven demand, which does not drift, not proven payment, which did.
Seen across all six signals at once, the winning shape is clear.
The highest-scoring ideas of the half, each with its full six-signal breakdown, are below. Open any row to see where a score comes from.
Where the highest-readiness ideas come from
Not every source surfaces equal ideas. Sorting June's scored ideas by the kind of source they came from, the highest launch-readiness sits with the places people actually ship and fund: launch platforms and venture pipelines. The lowest sits with the glossy trend coverage: media and consulting reports.
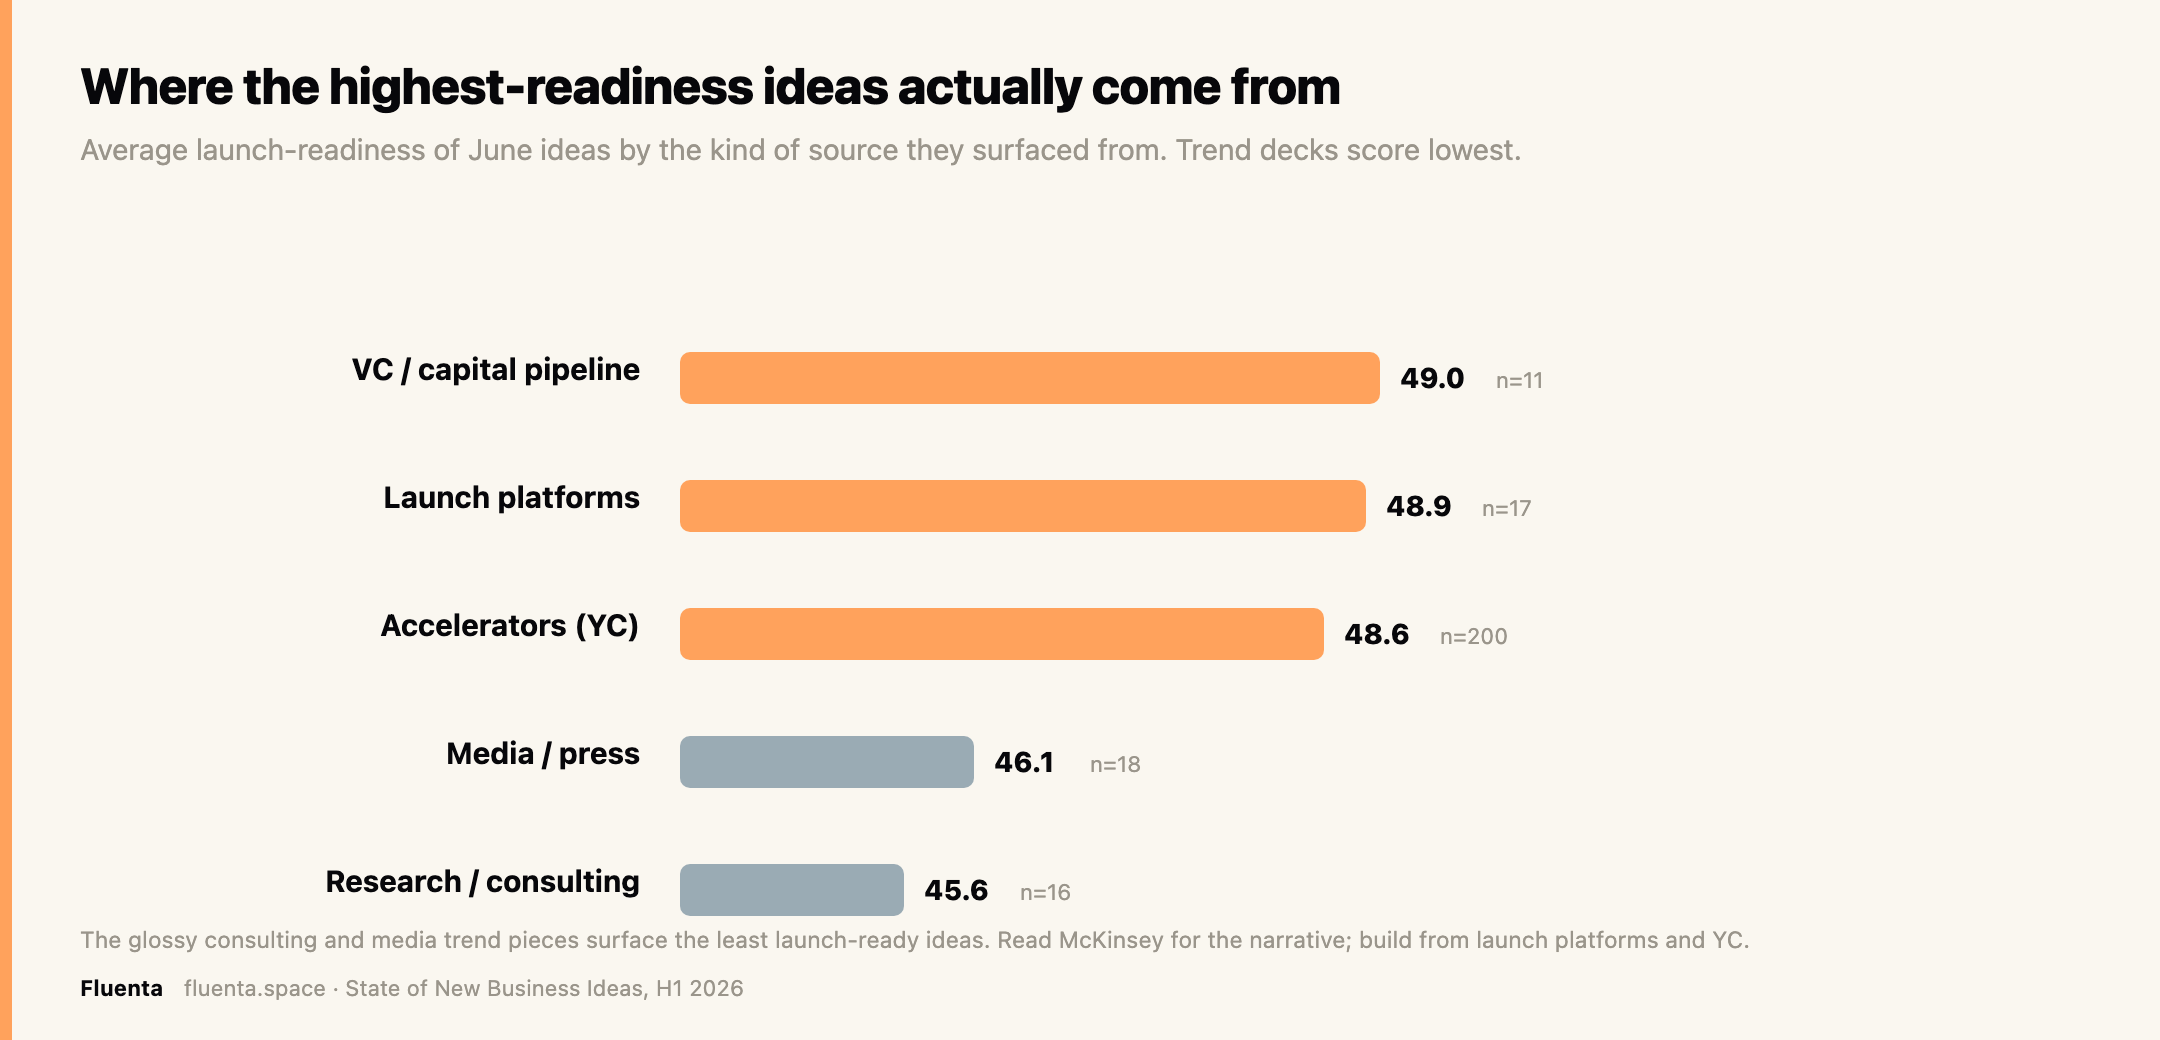
Read the reports for the narrative. Build from the launch platforms and the accelerator batches, where the readiness is highest.
Over-hyped and underrated sectors
Cross how much of the supply a sector commands against the quality of what it produces, and the map splits cleanly.
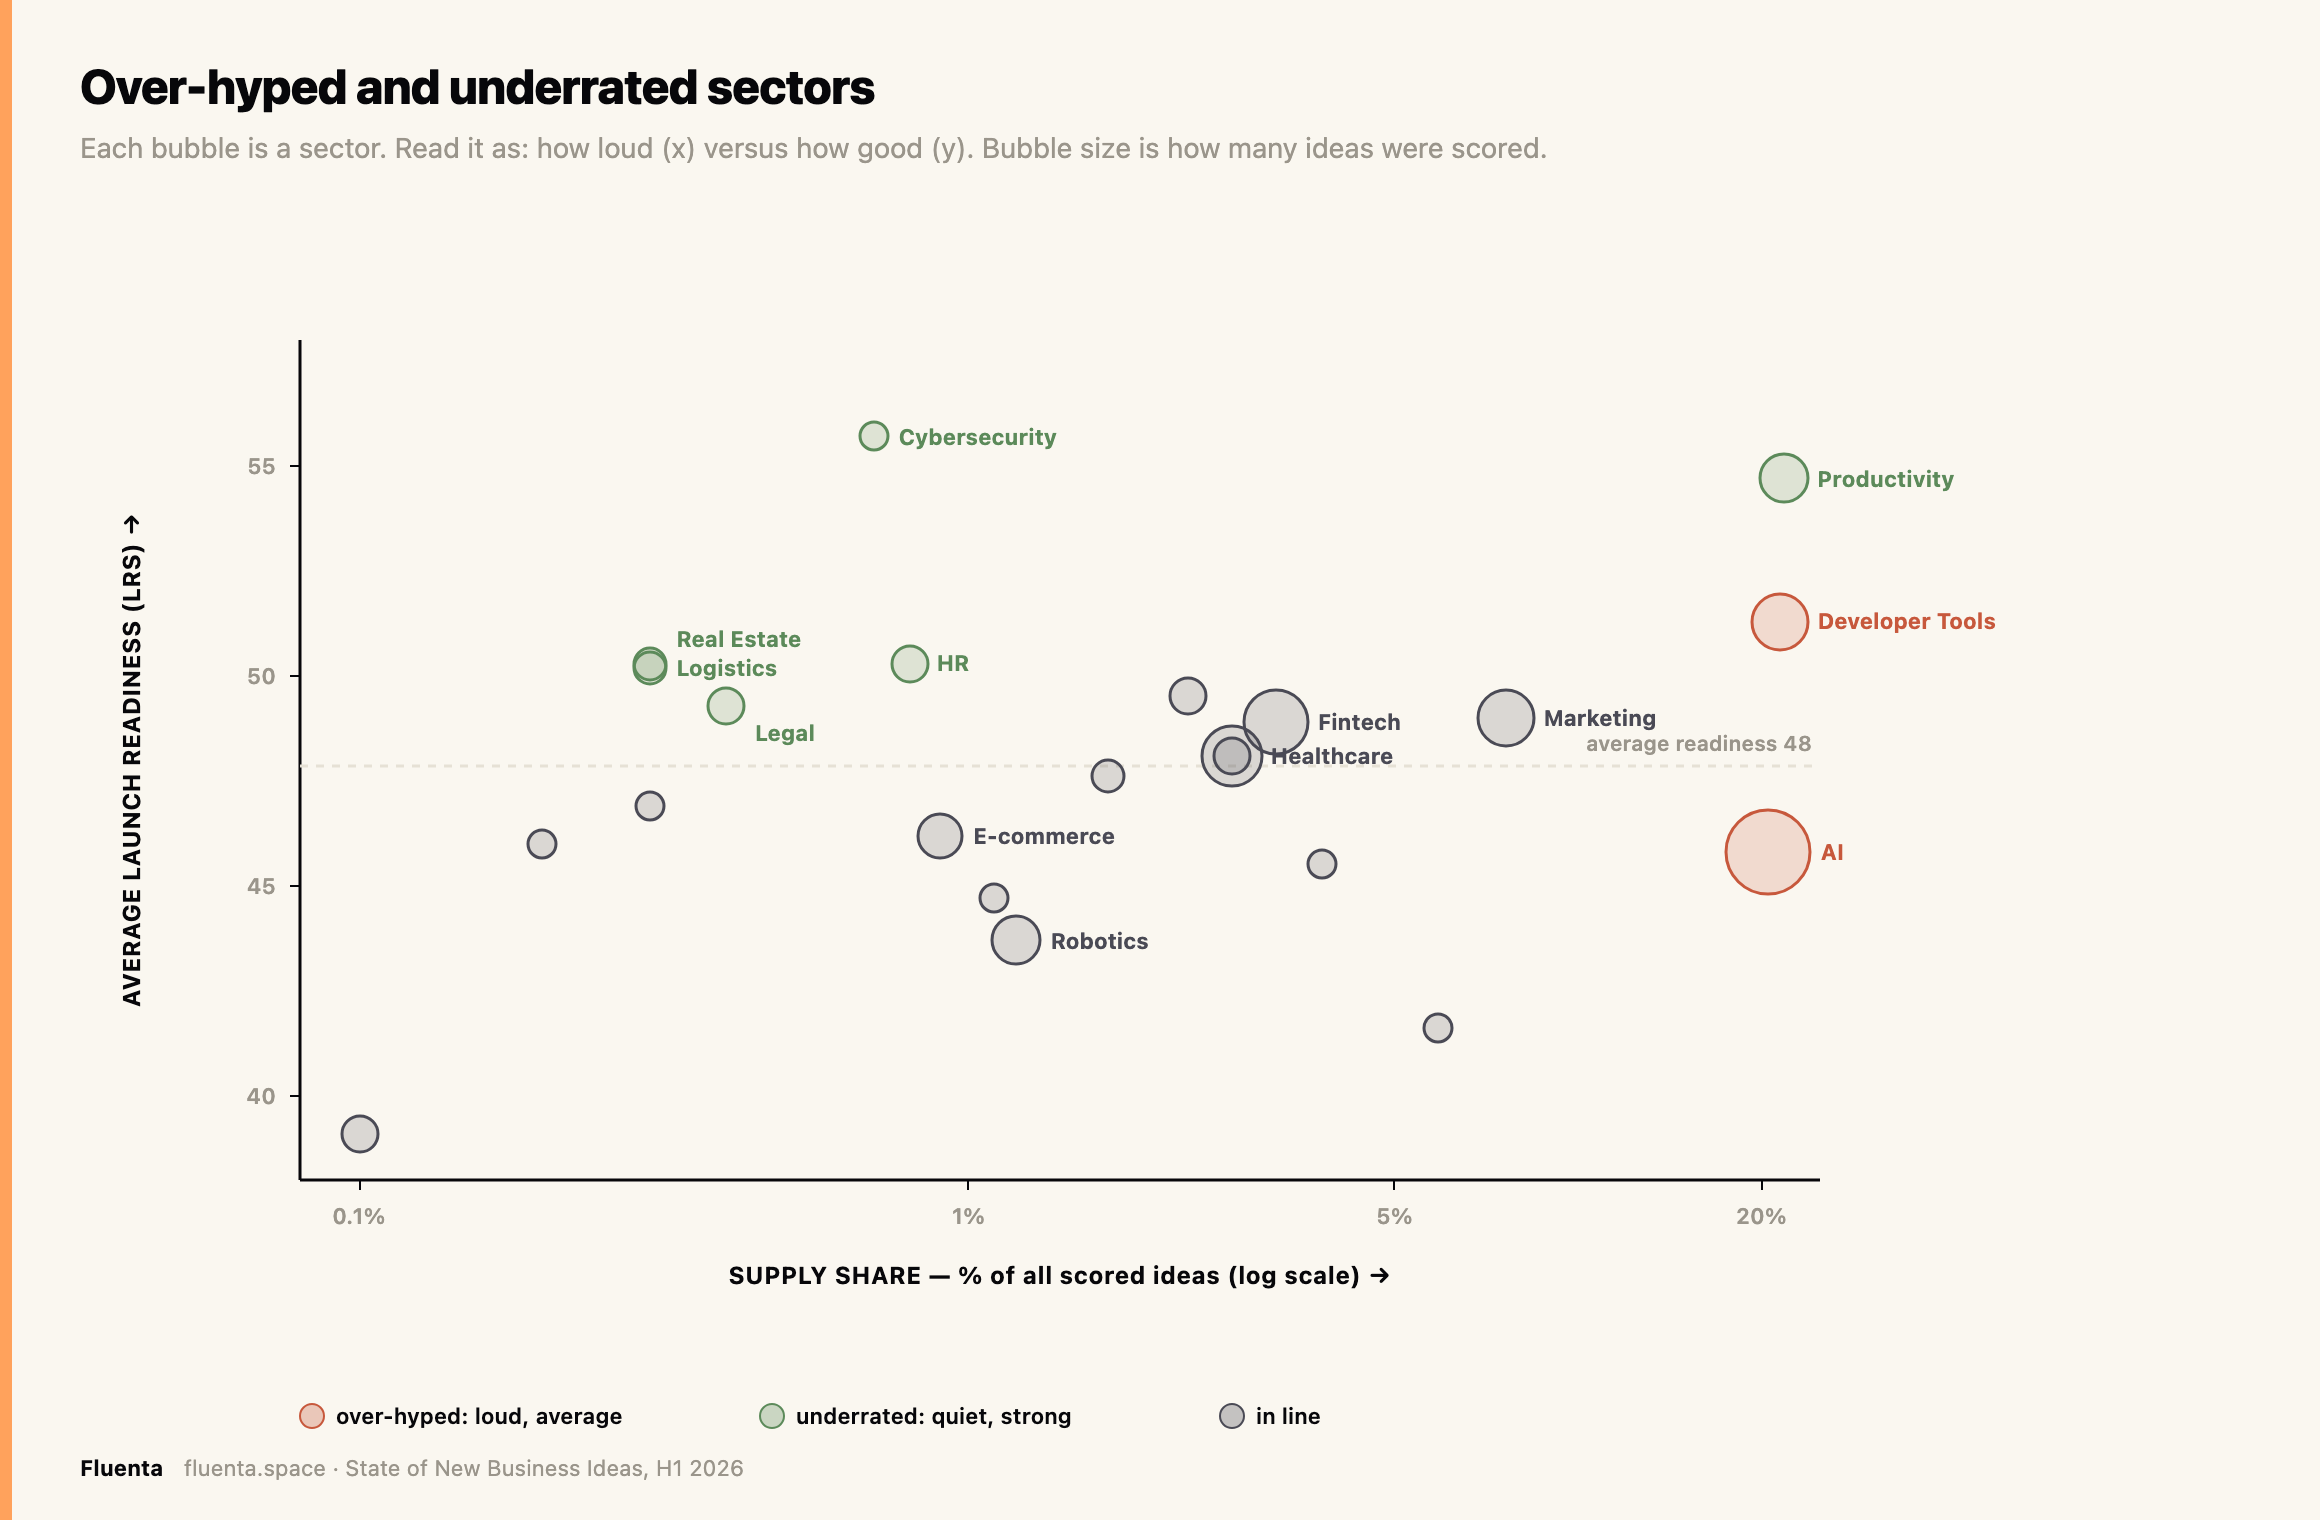
AI and Automation and Developer Tools are loud and merely average. Cybersecurity, HR and hiring, Legal and compliance, Real Estate, and Productivity score high on almost no supply. The same categories read as underrated in May, which makes this a structural pattern, not a blip. Build where the score is high and the crowd is thin.
What the market makes, and what founders actually want
Fluenta sees two things most idea lists cannot: what the market surfaces, and what founders quietly save to validate. Lining the two up exposes the clearest arbitrage in the report.
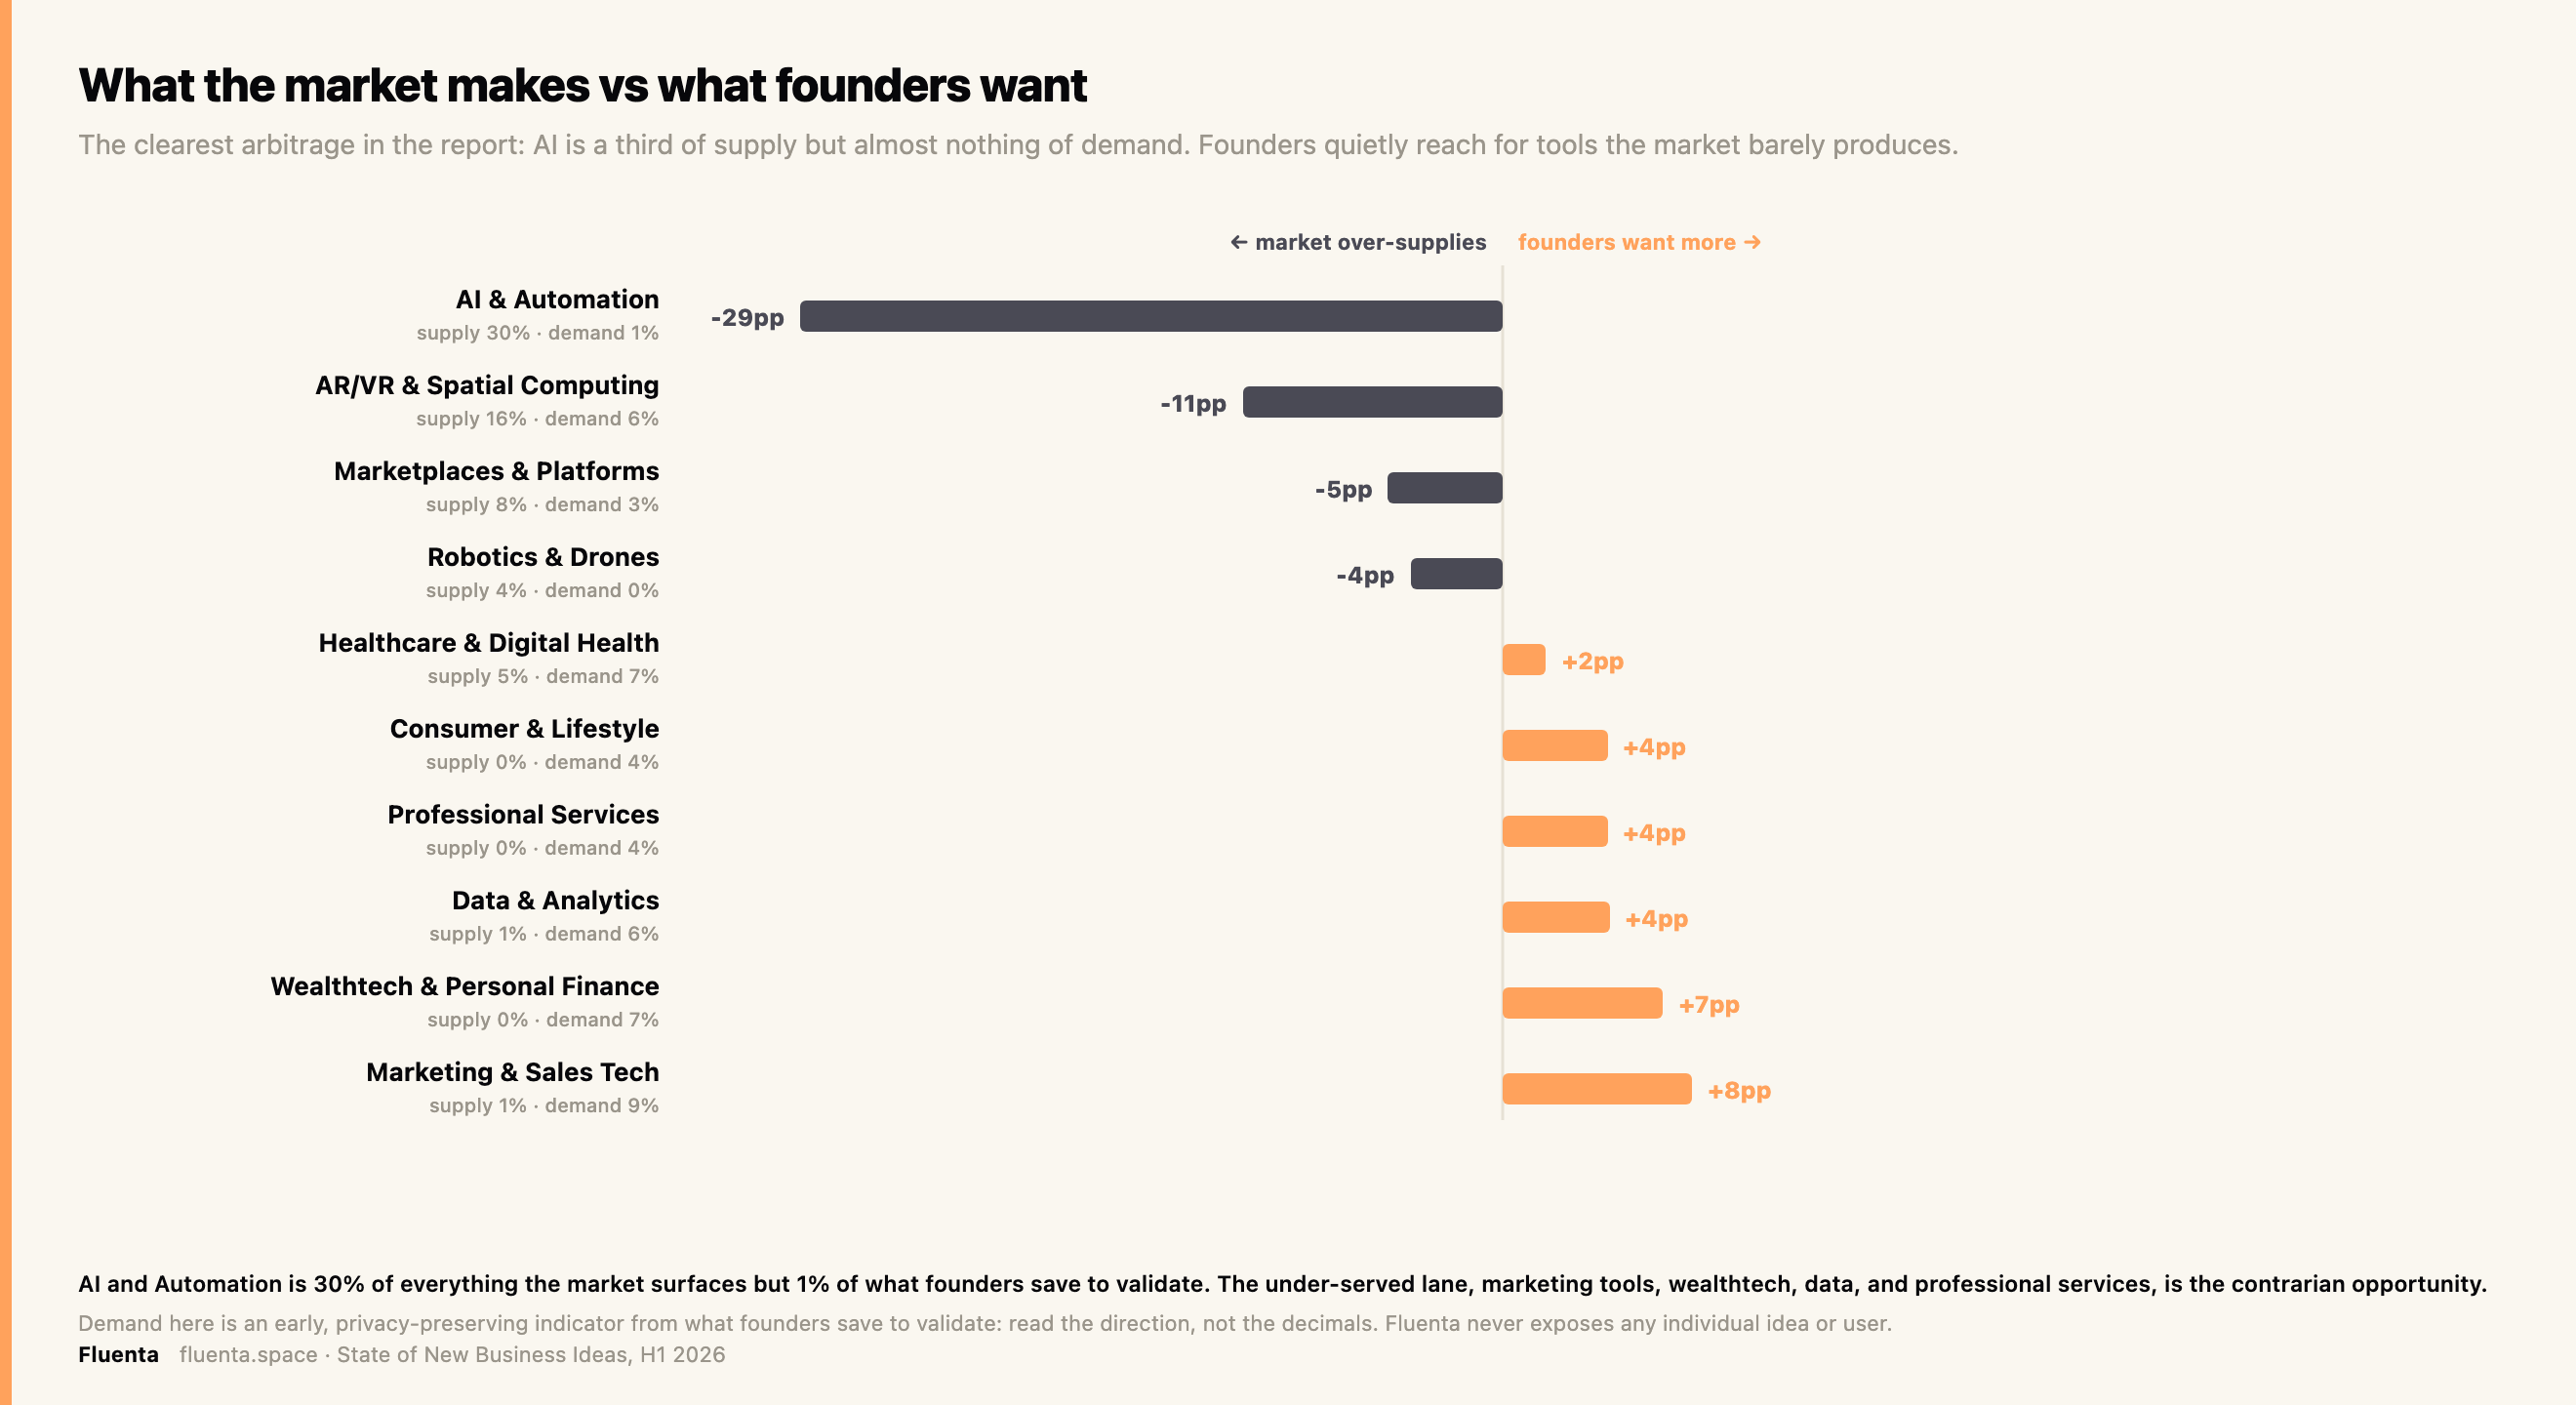
AI and Automation is about 30 percent of everything the market surfaces but only 1 percent of what founders save. The sectors founders reach for, marketing and sales tooling, wealthtech and personal finance, data and analytics, professional services, and consumer, are barely present in the feed. Building against the supply curve, toward that under-served demand, means less competition for the same customer. The demand read is an early one, privacy-preserving and directional rather than precise, but the direction is unmistakable: the market over-produces the one category founders are walking away from.
The buildability map: what to actually build
Ease of build and demand, taken together, sort every idea into four corners. Only the top-right, easy to build and clearly wanted, is worth starting from. So it is named, not left as an anonymous cloud.
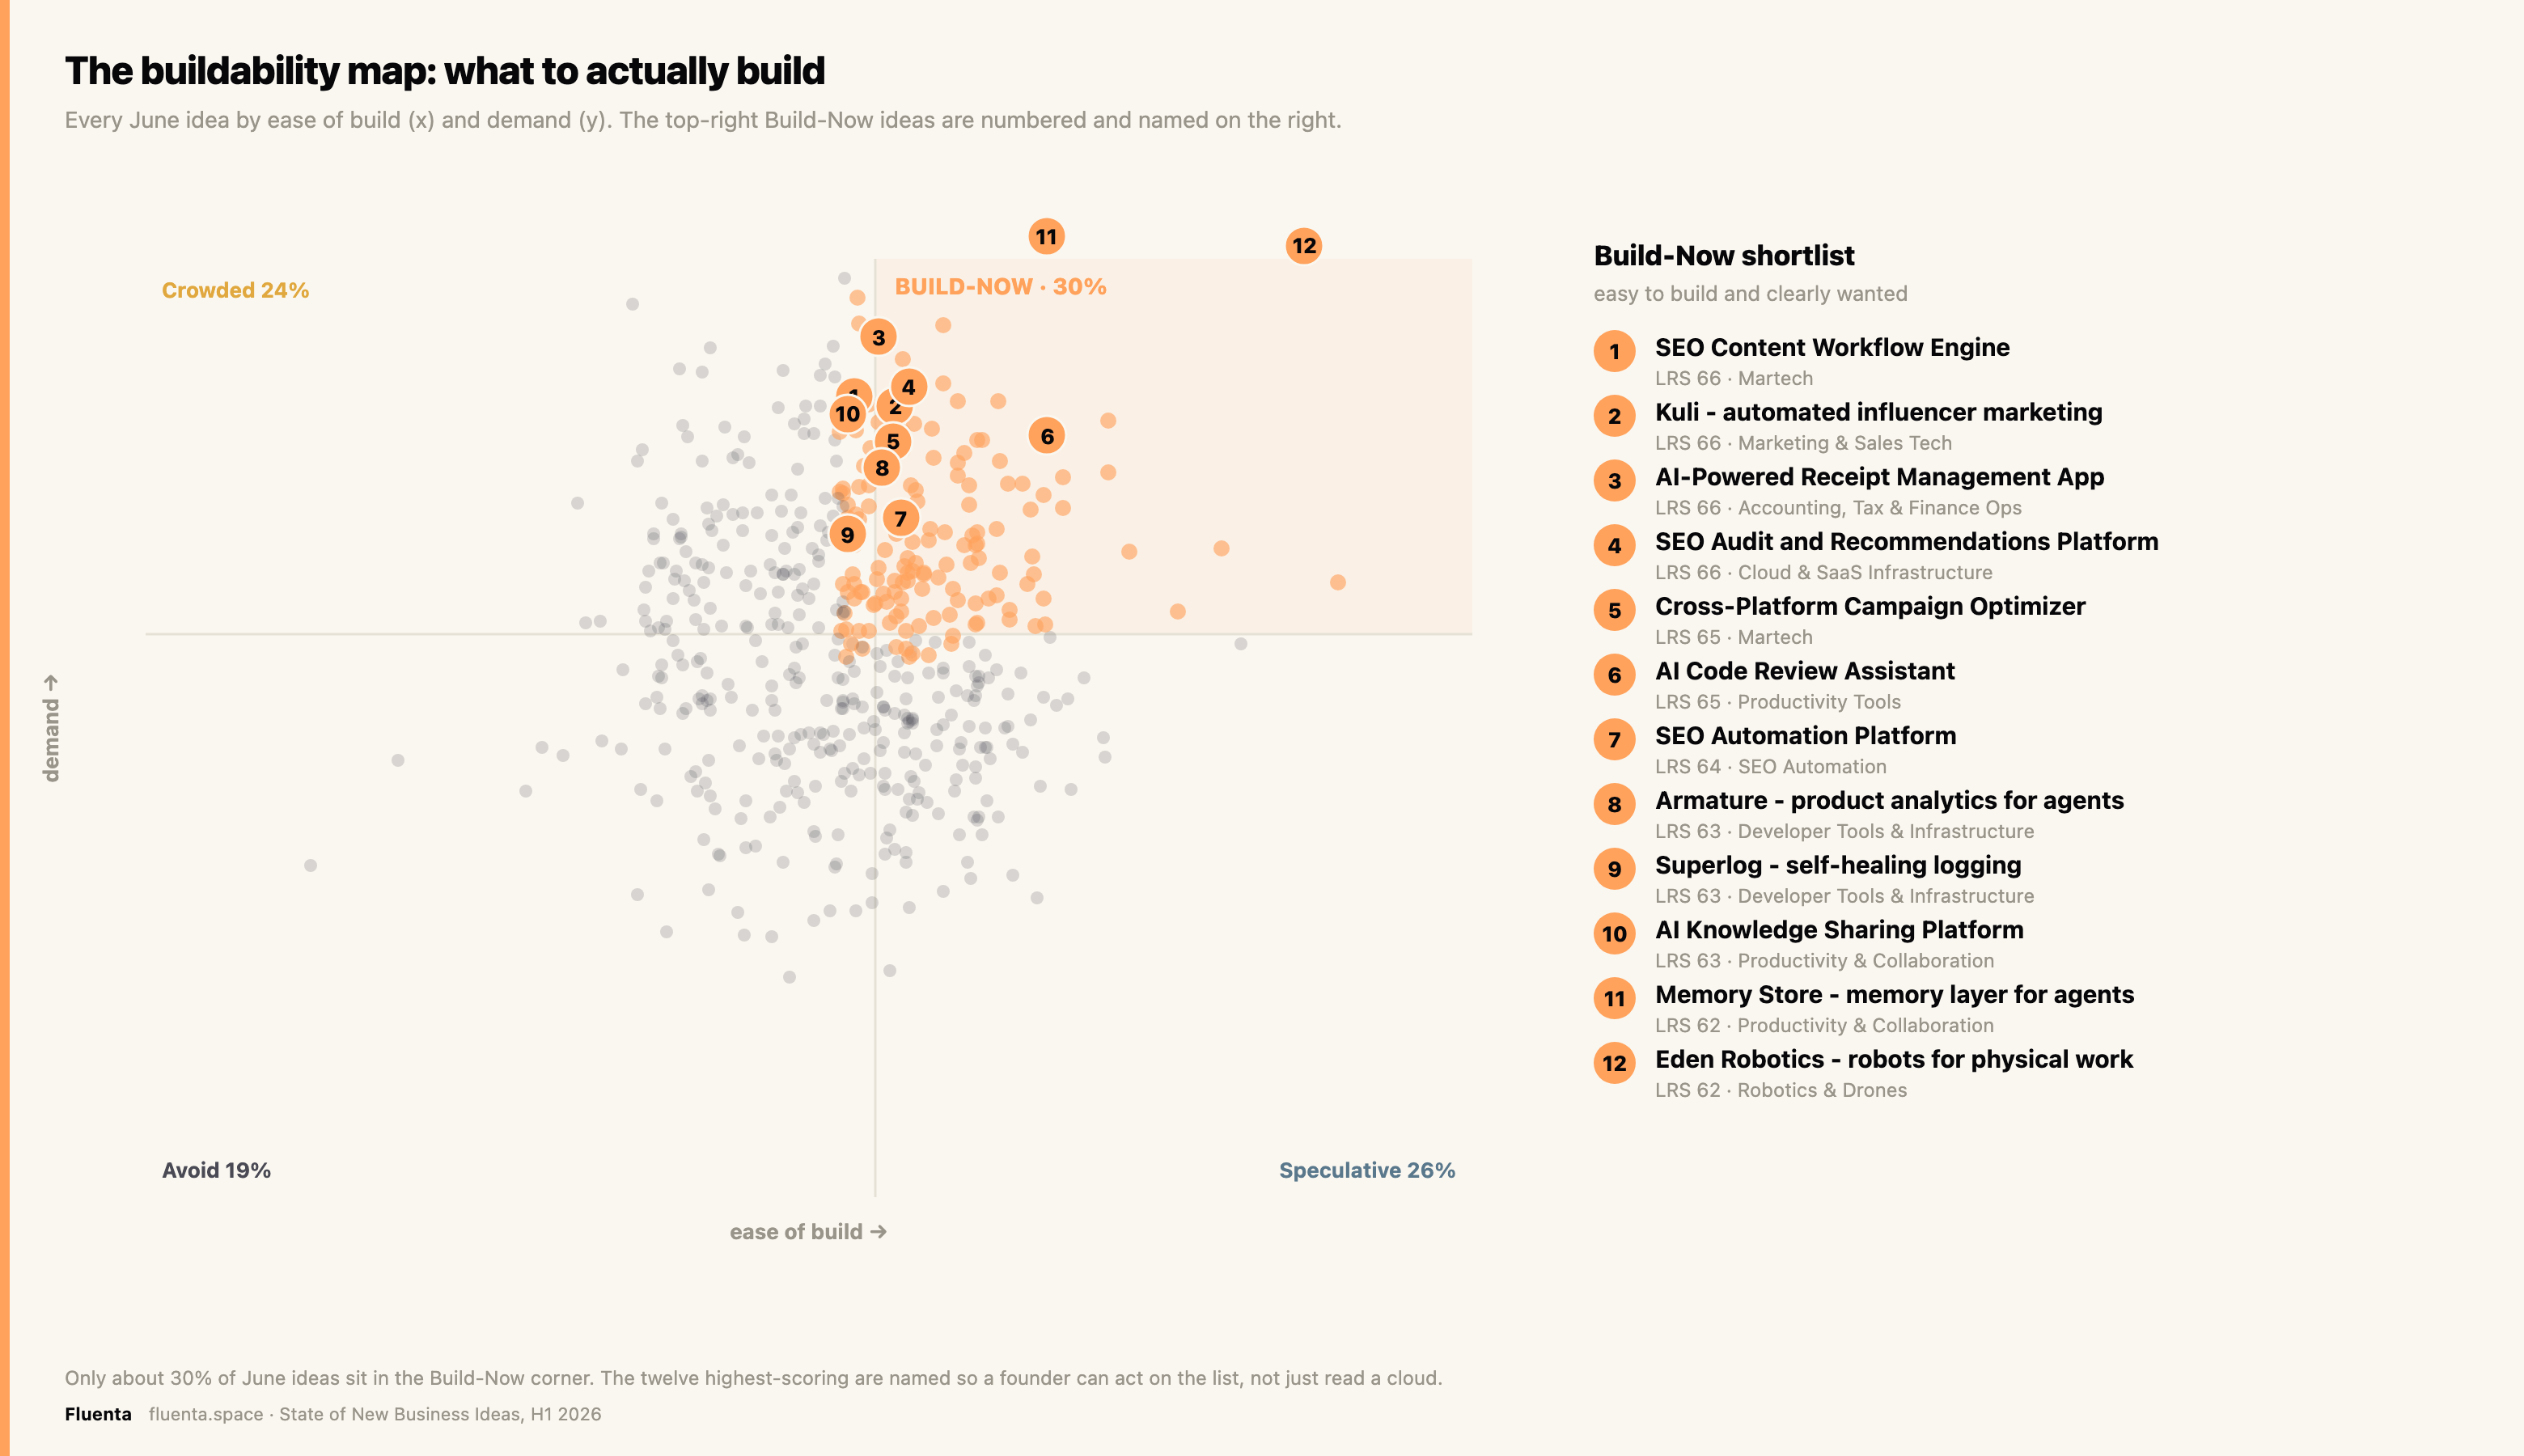
About 30 percent of June ideas sit in that Build-Now corner, up from 26 percent in May. The named shortlist under the chart is where a founder with no inside edge should start. The founder's entire edge is the discipline to refuse the other 70 percent.
Pain is cheap. Payment is the moat.
The most expensive mistake in the scored set is the idea with a burning problem that nobody pays to solve. It passes every gut check and fails at launch. Reading pain and payment together, across two months, shows the trap and how it moved.
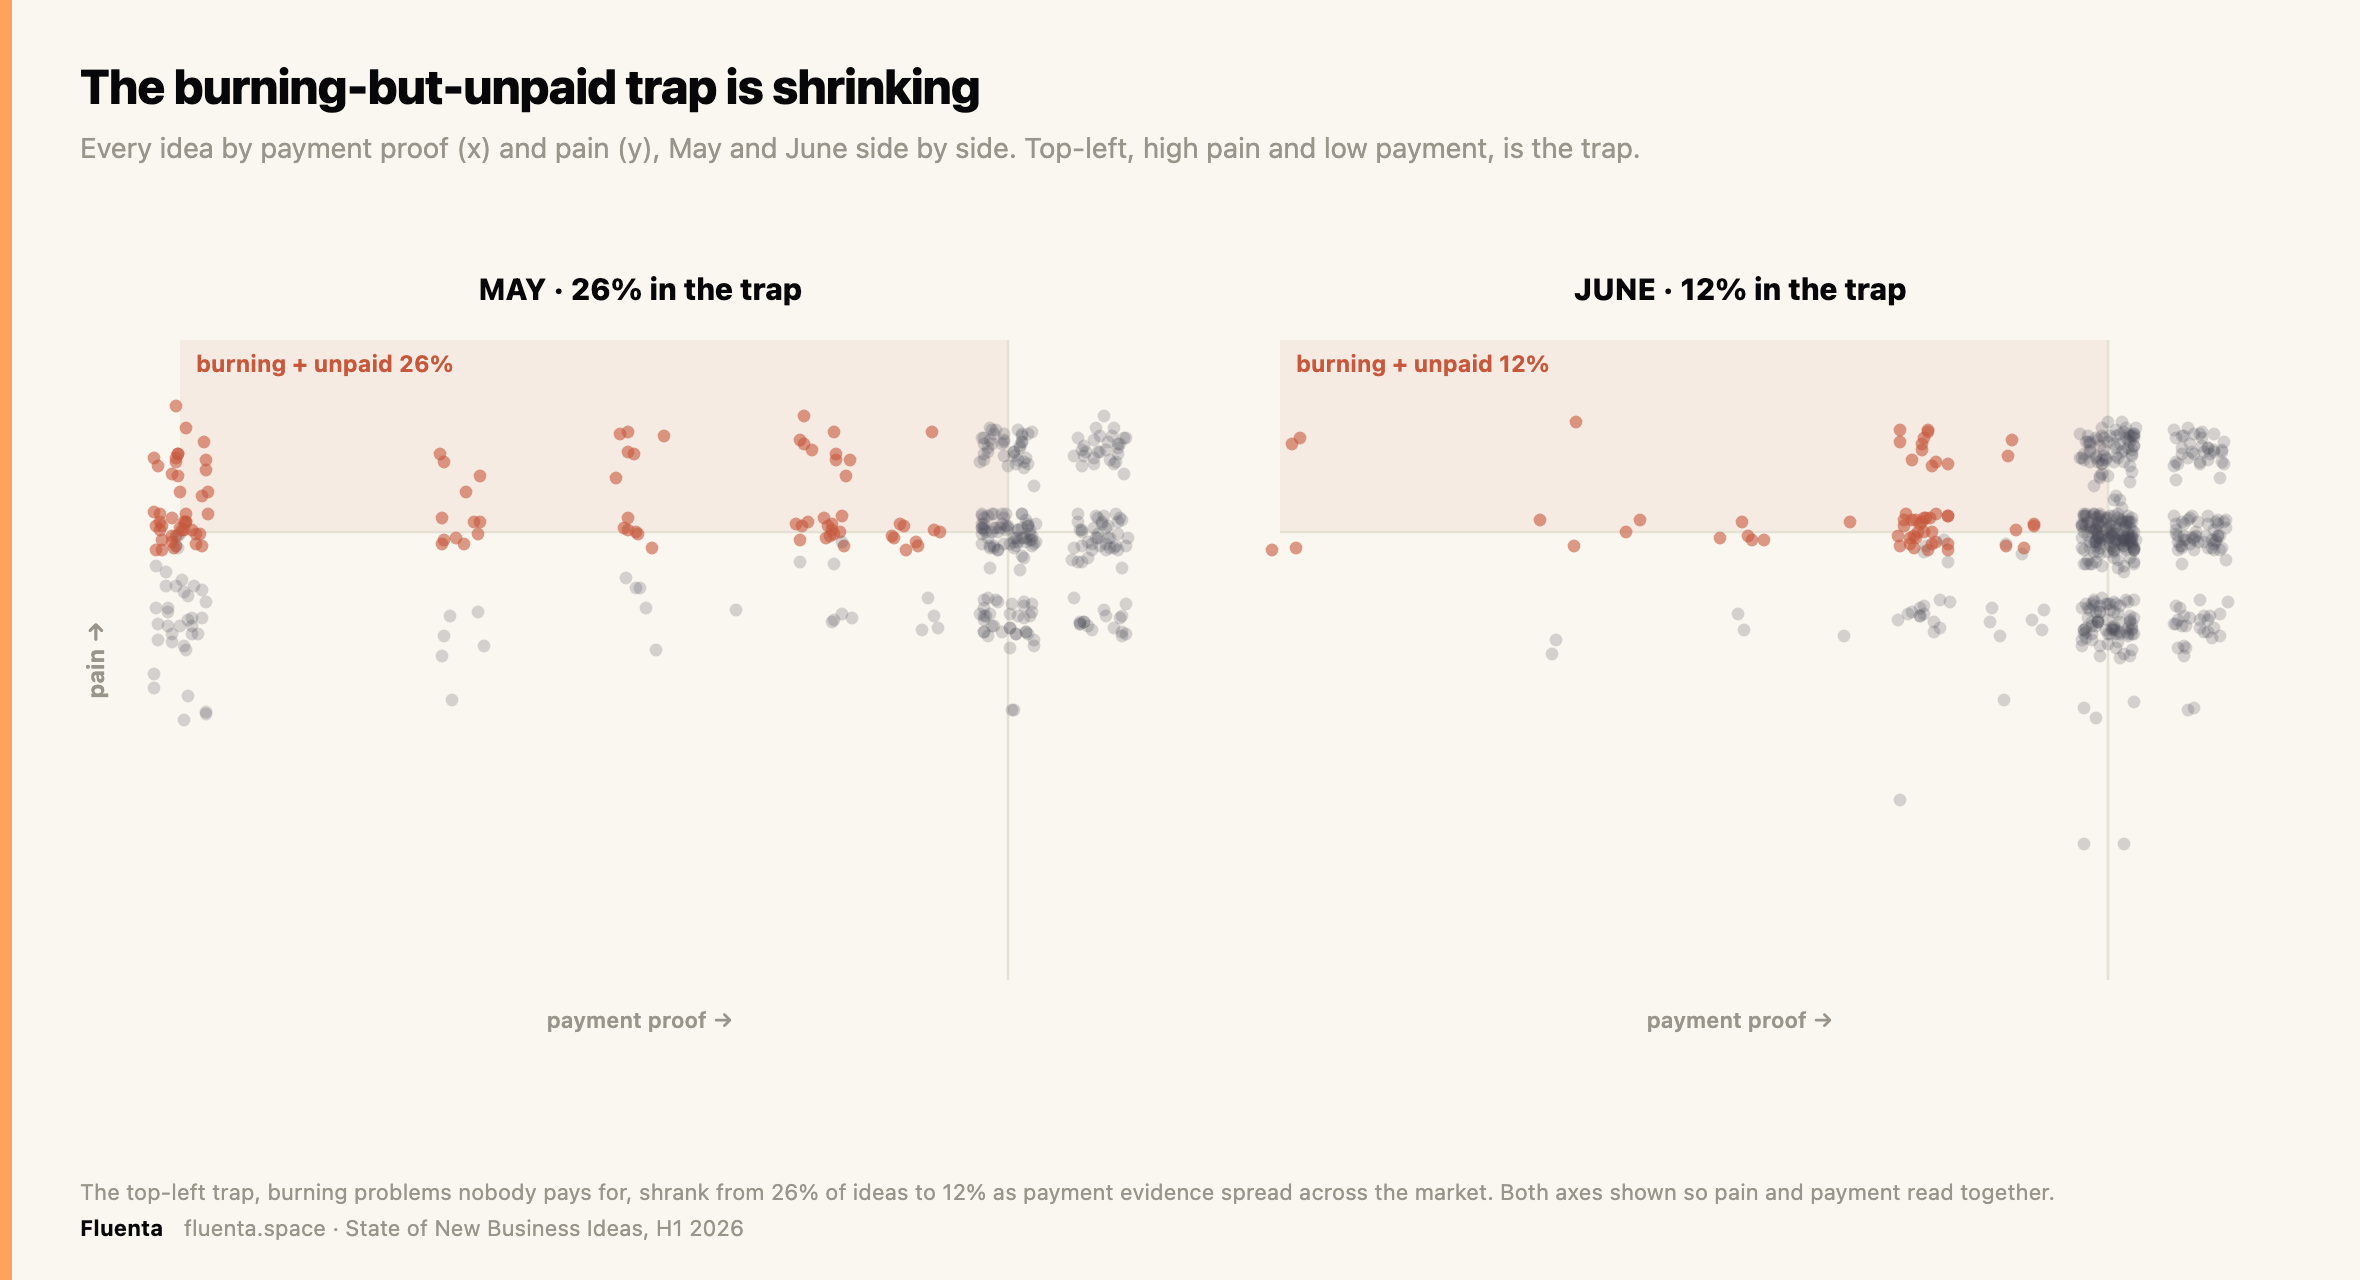
In May, 26 percent of scored ideas landed in the top-left trap: high pain, weak payment evidence. By June only 12 percent did, as payment evidence spread across the market. The trap is shrinking, but the defense is unchanged: charge one real customer in week one, not month six.
The Business Idea Demand Index, and the June turn
The Business Idea Demand Index, or BIDI, compresses quality, demand, monetizability, and novelty into a single monthly reading. It moves from 50.4 in March to 54.3 in June, holding in the Stirring band and rising through the half.
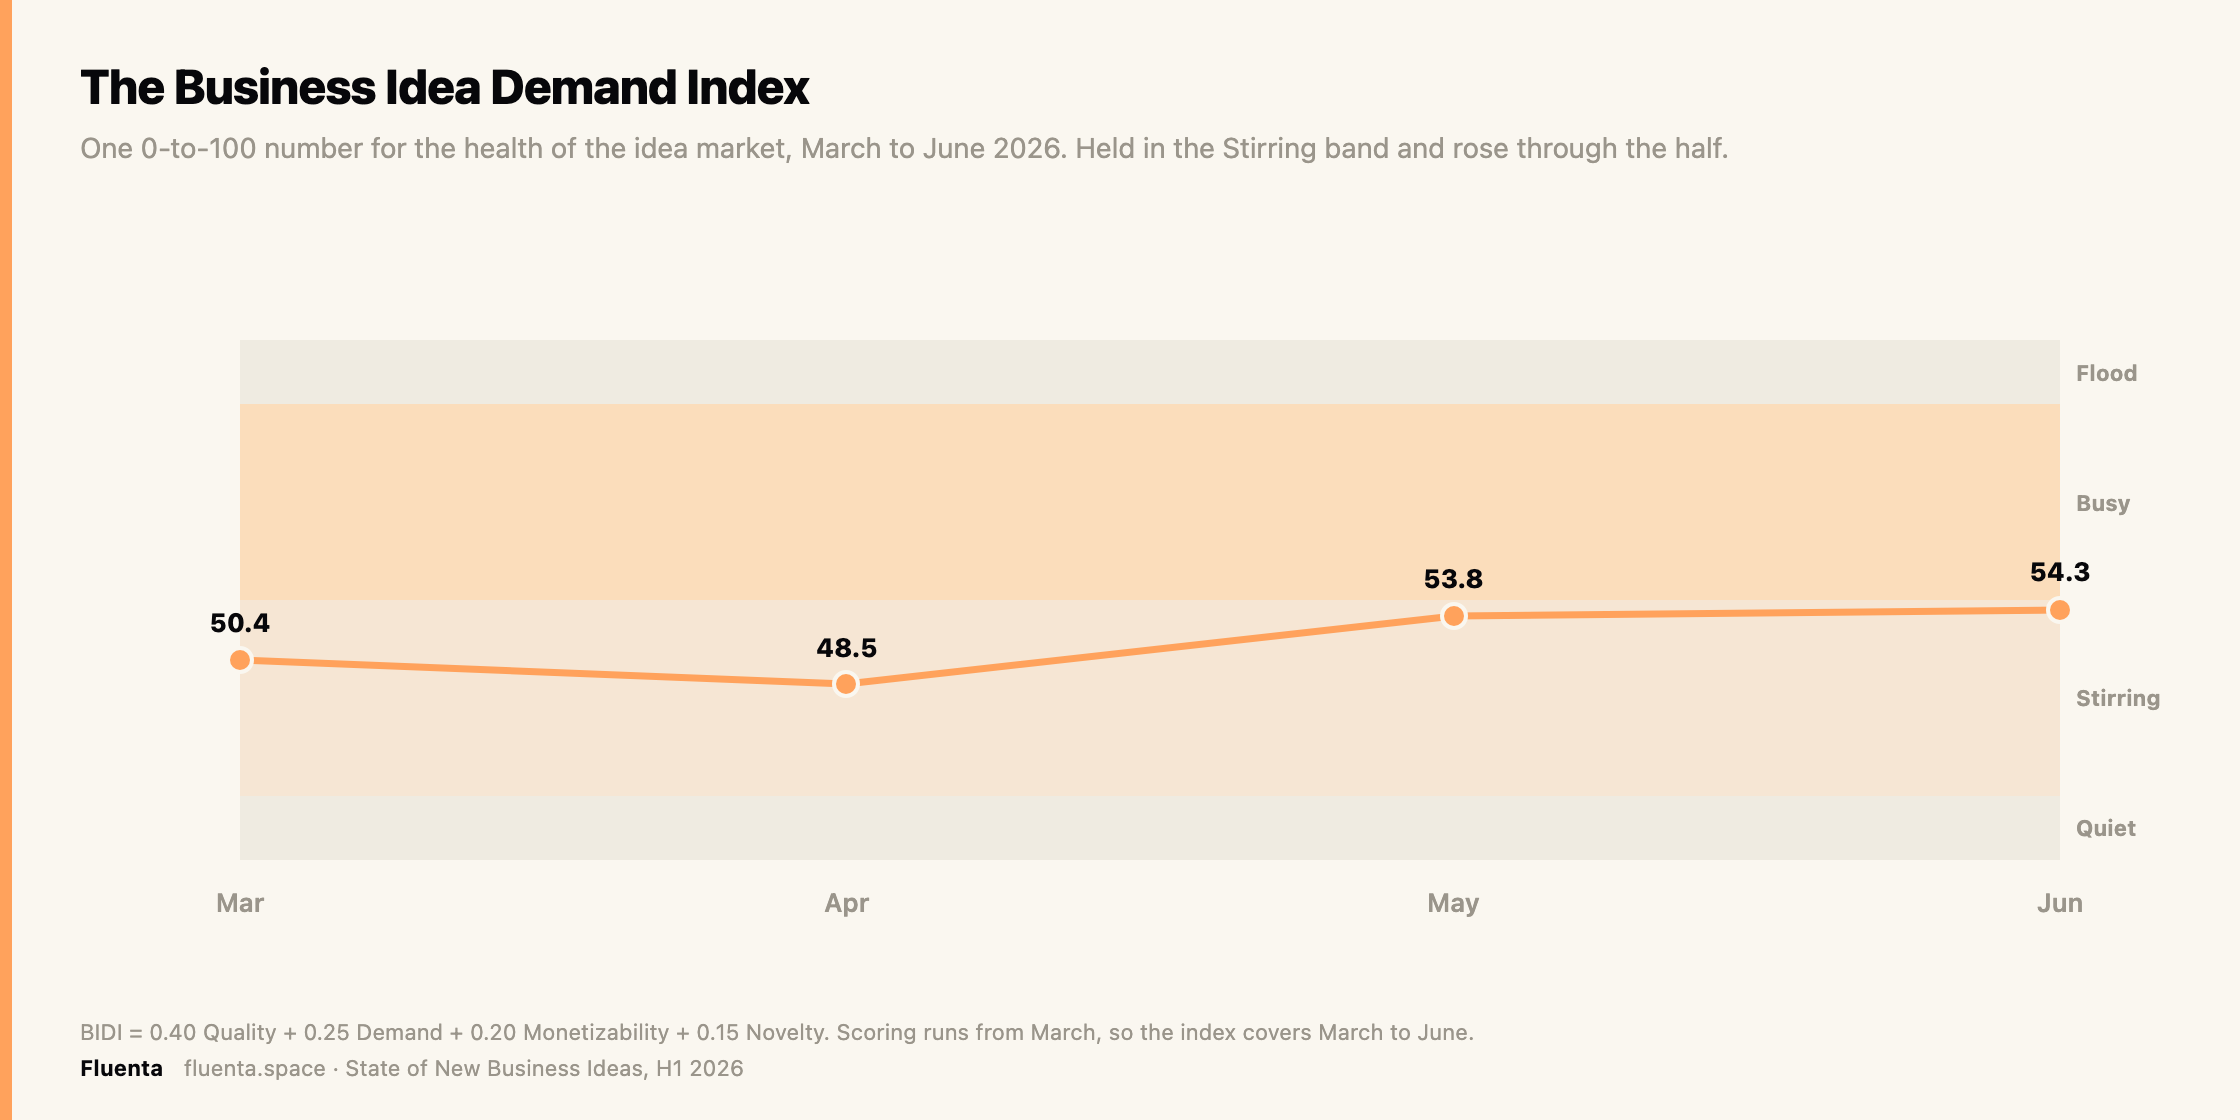
The rise has a clear driver, and the index is simpler than it looks. It blends four parts, and the chart below says exactly what each one measures, so the numbers are not a black box.
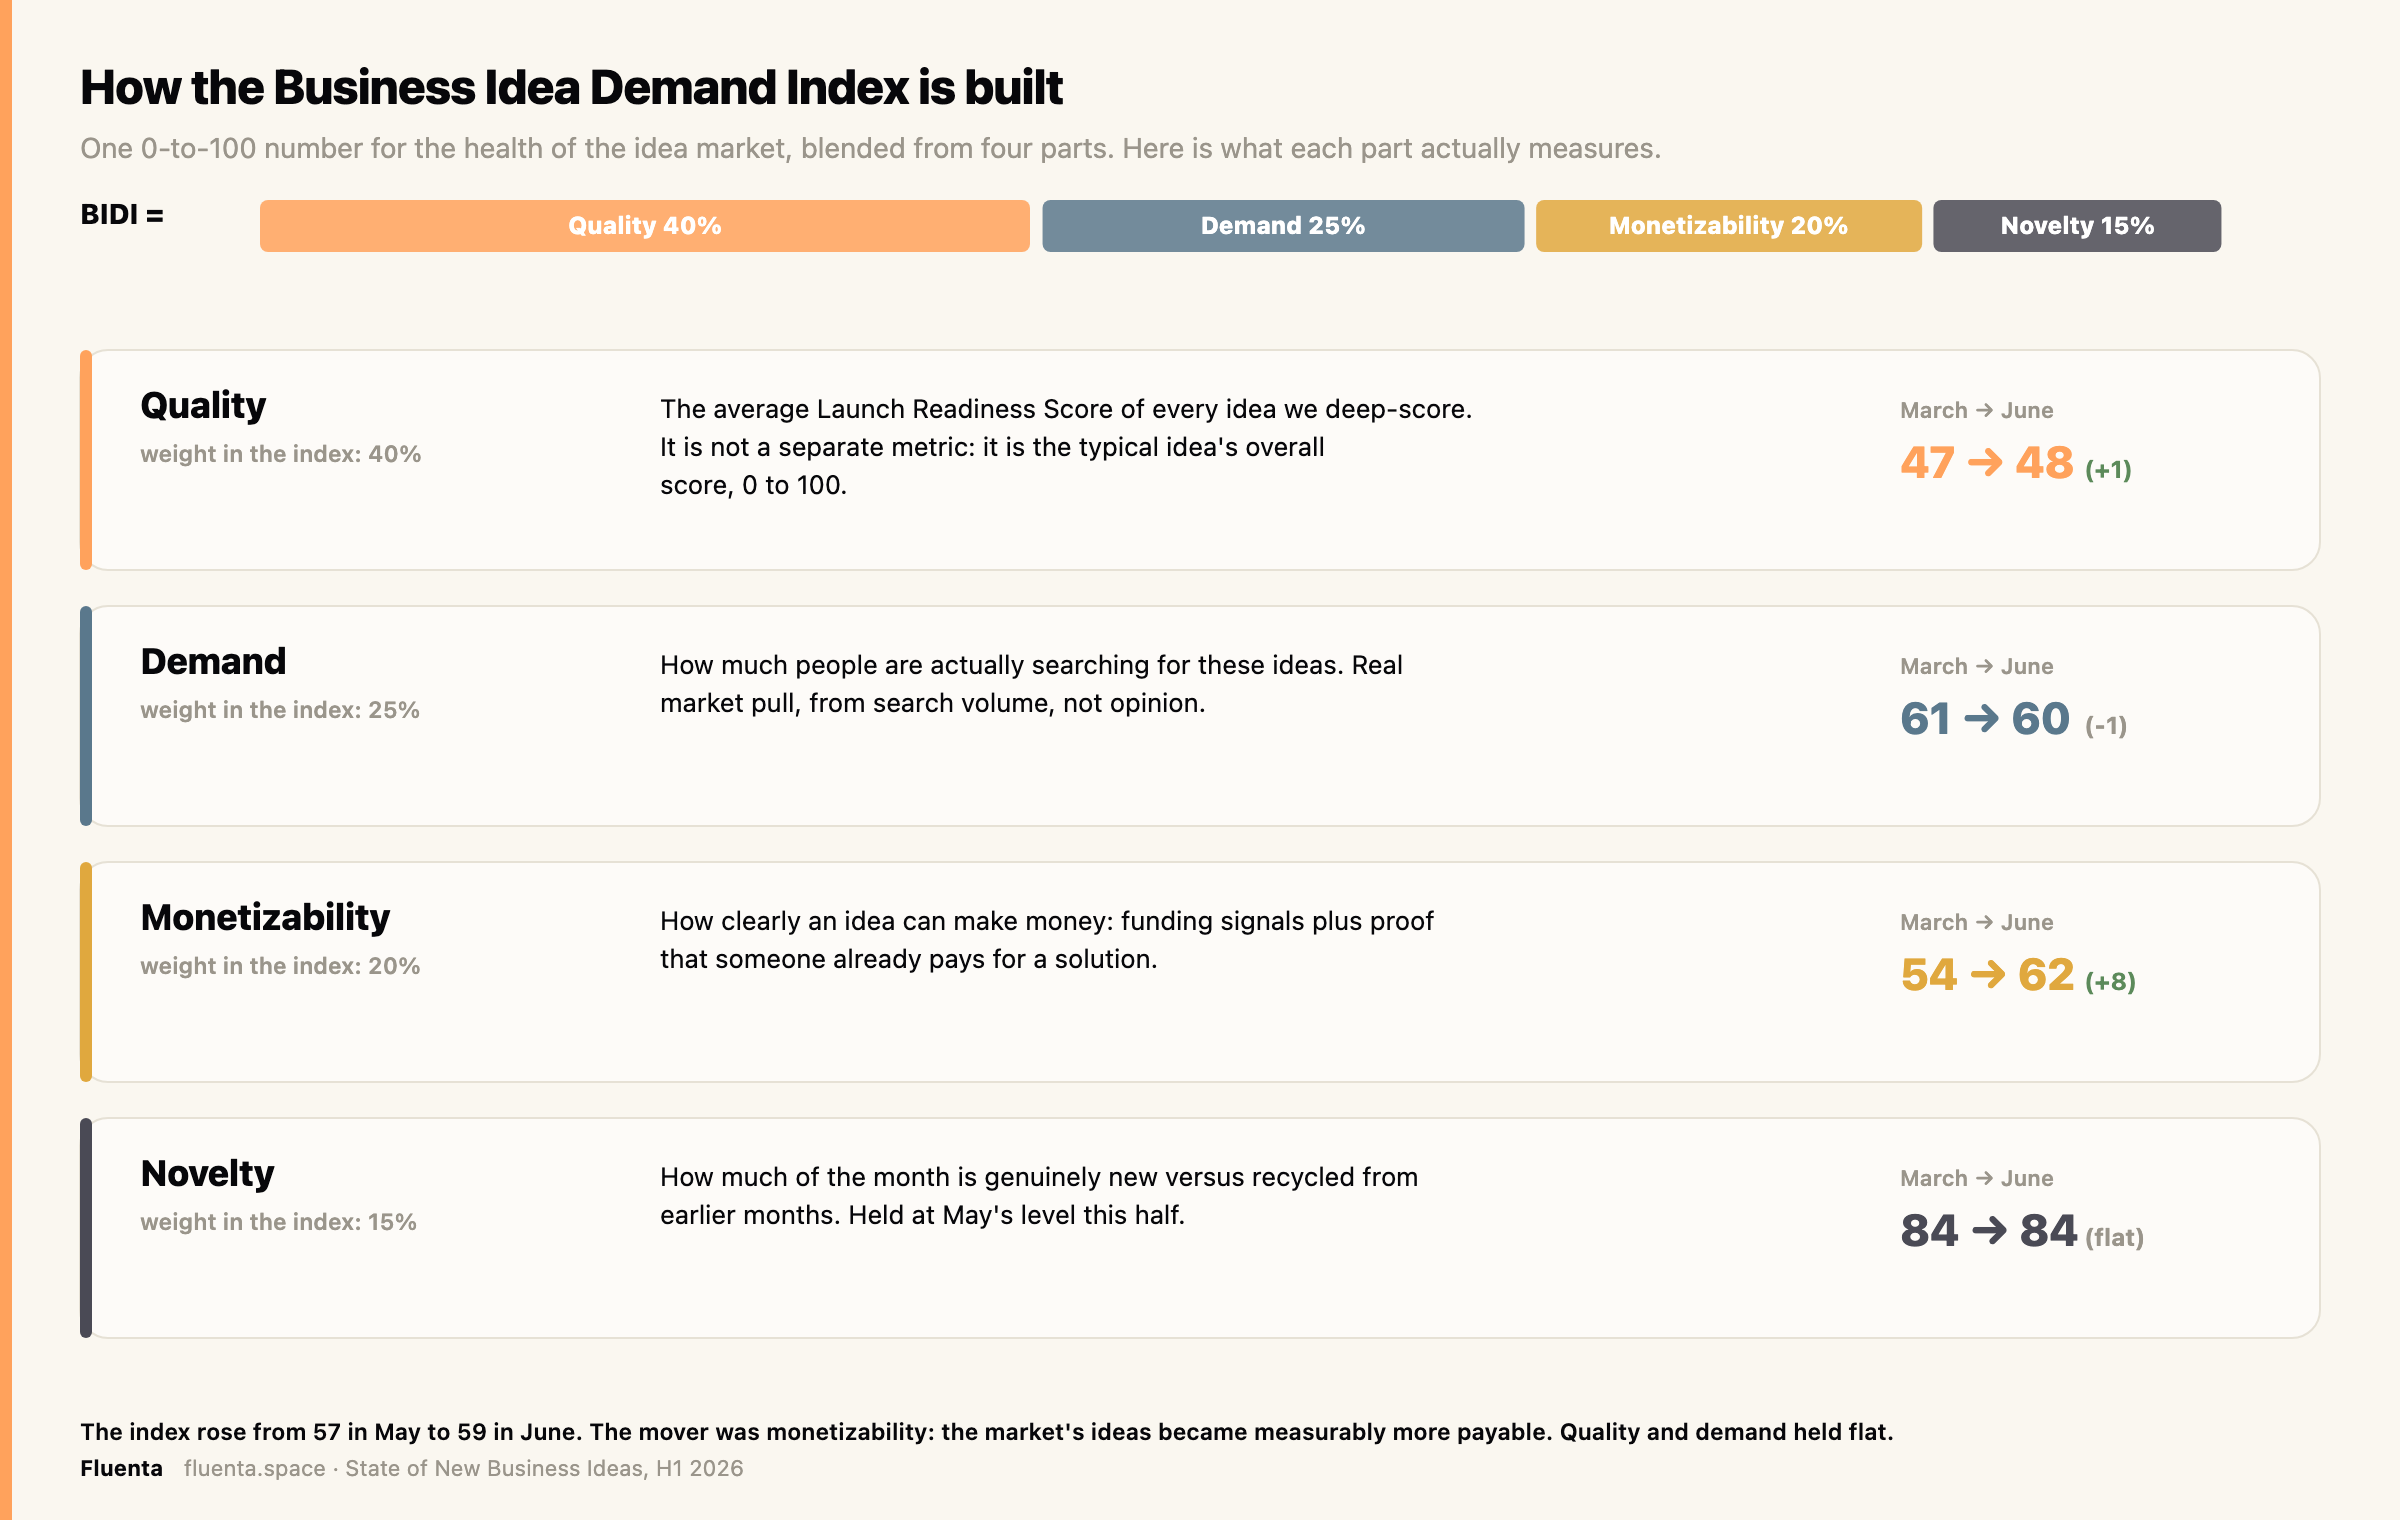
The mover was monetizability: how clearly an idea can make money, from funding signals and proof that someone pays. It rose from 54 to 62 across the half. Quality, which is just the average readiness score, and demand held flat.
Two honest caveats sit on the index. Part of the April-to-May rise reflects a scoring-model change in the monetization signal. And the novelty input is under review, which is why the reading is presented as a direction, Stirring and rising, rather than a hard band crossing.
So what should a founder do with a four-point rise? Read it as the market's climate, not a scoreboard for any single idea. The gain came almost entirely from monetizability, with quality and demand flat, so it does not mean ideas got better or that a crowd is piling in. It means conditions now favor ideas that can show, early, how they make money. The move is to pick a wedge where payment proof is within reach rather than to chase novelty, which the index still holds under review, and to score the specific idea on its own six signals before building. Stirring and rising is a window for monetizable bets, not a signal to rush, and the direction matters more than the decimals, since part of the climb is a scoring change rather than a real jump in the market.
How to read this report
Three rules keep the numbers honest.
A launch is not an idea, and an idea is not a business. The three counts shrink at every step and are never blended.
A high score is a demand prediction, not a verdict. The score prices the demand; the founder supplies the execution.
Volume rose partly because coverage rose. Only same-source comparisons carry a trend claim, which is why the eleven-month volume story stays on the launch platforms alone.
A low score deserves its own caveat. A business-to-business idea with no public footprint, one nobody searches on Google and nobody vents about on Reddit, will score low even when the demand is real and contracted. A founder holding signed letters of intent in that wedge has an edge the public score cannot see.
What a founder should do now
Six moves, each drawn from this half-year of data, each one you can start this week.
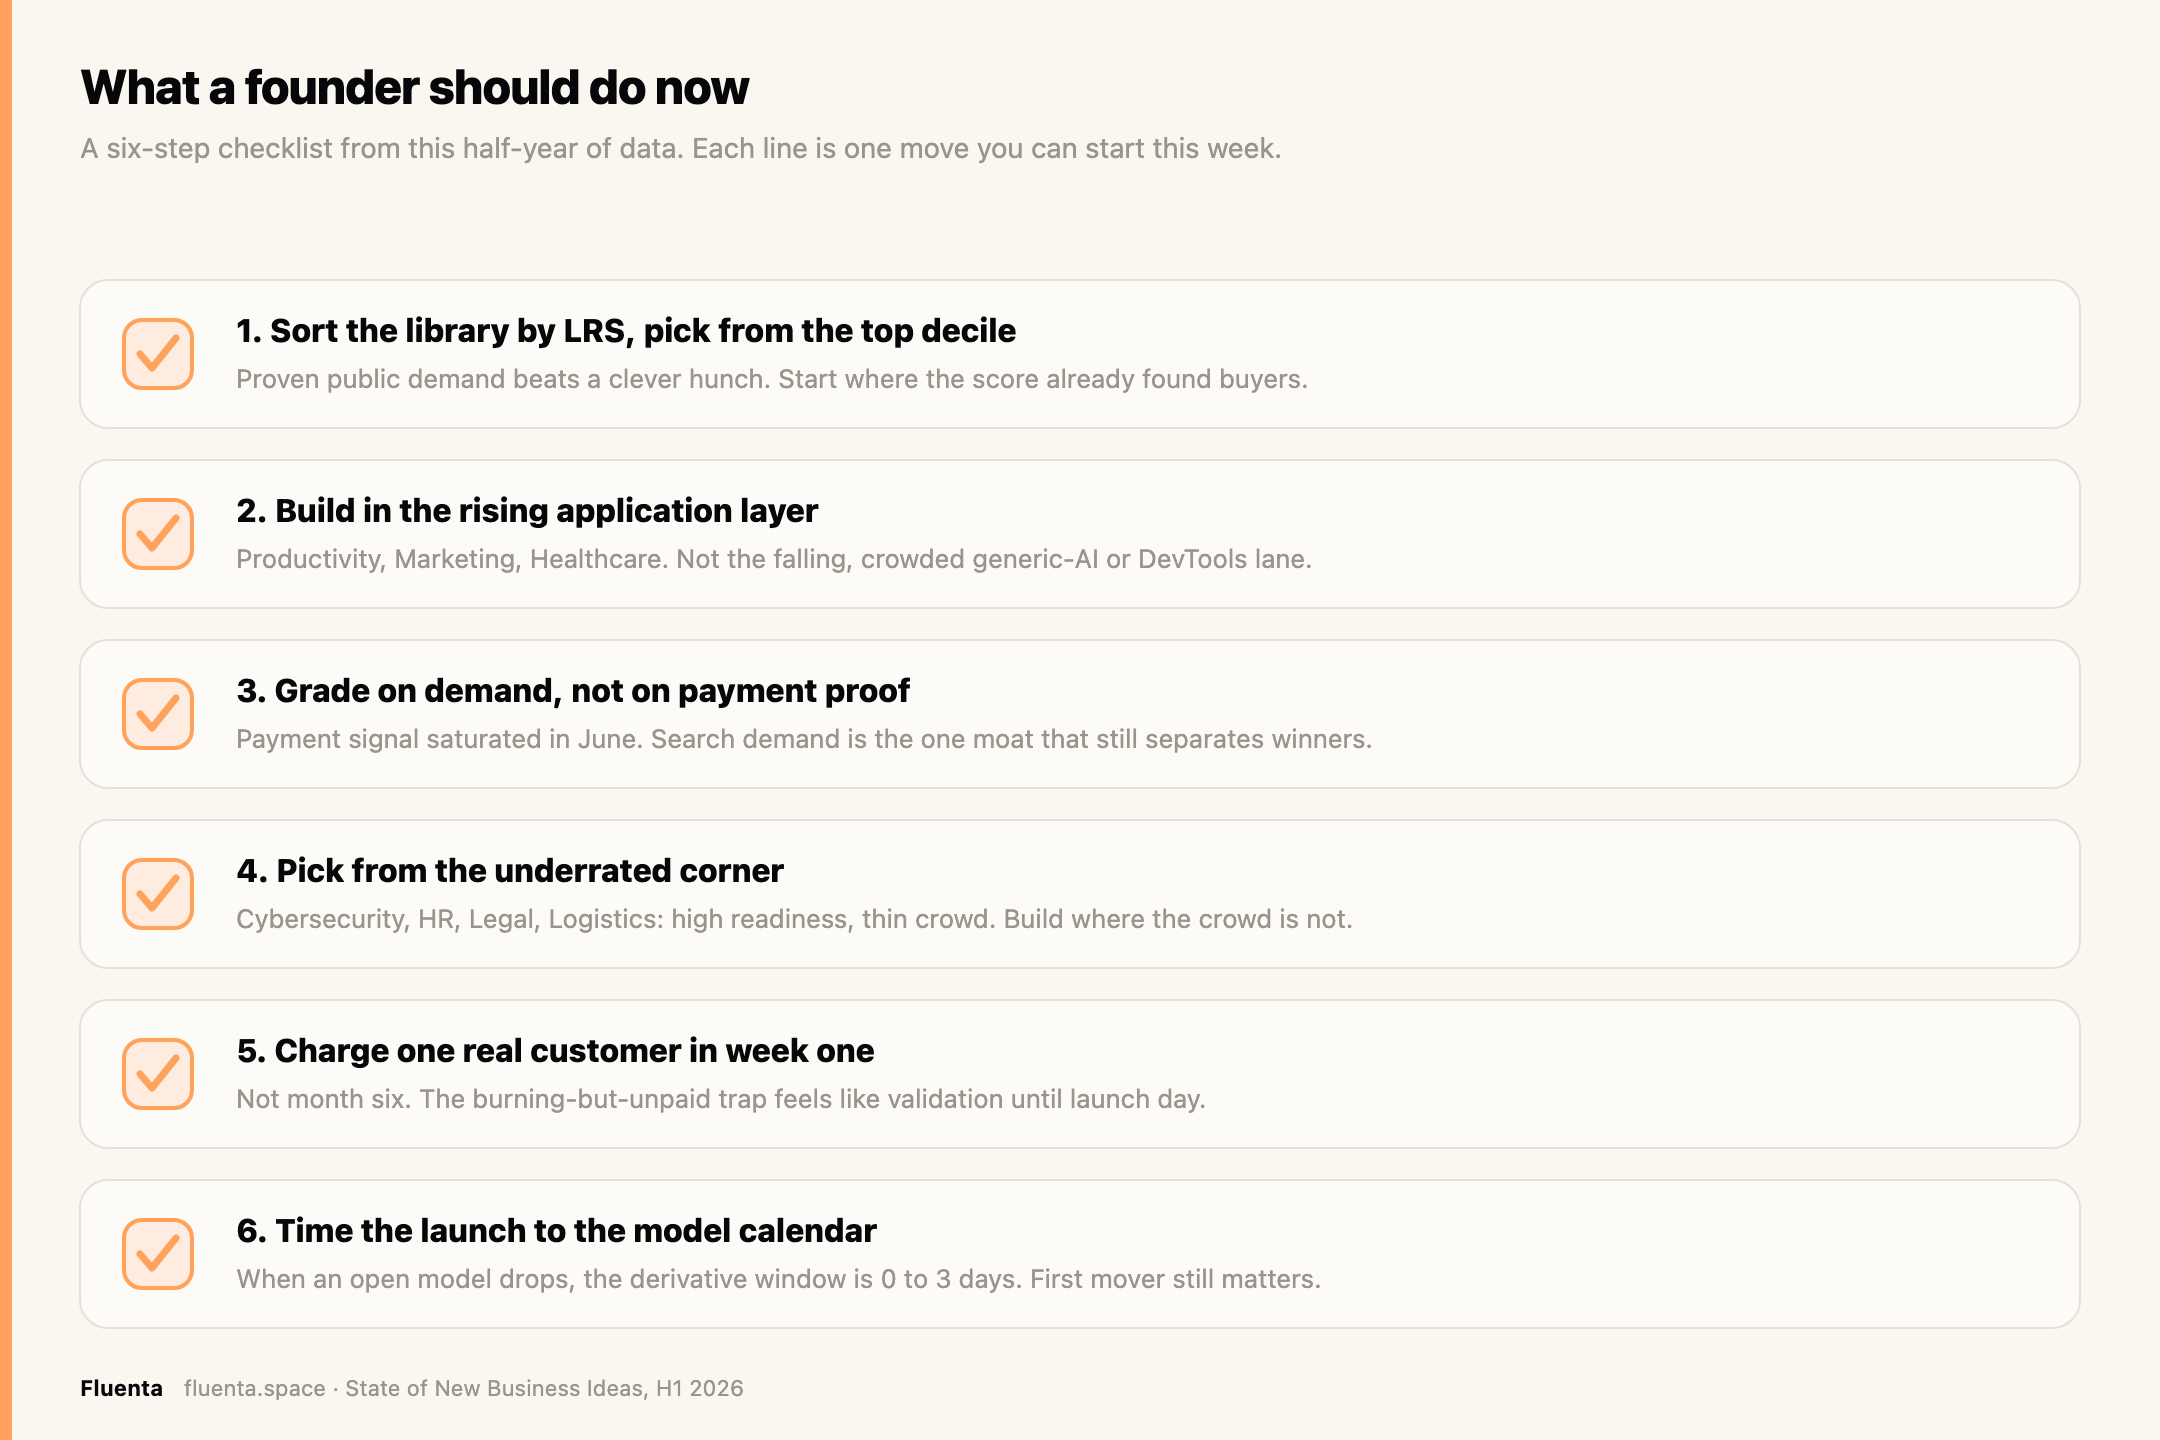
And one rule the checklist cannot capture: if you hold private business-to-business demand, ignore the public score and build exactly where it is blind. A low public score is your moat, not a warning.
Subscribe to be the first to know
New business ideas, scored daily. Weekly trends, insights, idea kill lists.
Free. Subscribing creates your Fluenta account so you can score your own ideas too.
The full top 20
The 20 highest Launch Readiness Scores of H1 2026, searchable and sortable by score, sector, or source.
The highest-scoring ideas of H1 2026
Top ideas by Launch Readiness Score for each scored month, ranked. Each name links to the Fluenta app; open a row for the full six-signal breakdown. A score is a demand prediction, not a verdict.
Python Automation ScriptingCustom scripts for scraping, bots, and repetitive task automation66.2›
Category. In-Demand Freelance
Scored in. 2026-03
LRS breakdown
SEO Content Workflow EngineContinuously generates and optimizes SEO content66.2›
Category. Martech
Scored in. 2026-06
LRS breakdown
Open Vibe - AI SaaS coding flowAI workflow for shipping SaaS apps fast65.9›
Category. AI App Builders
Scored in. 2026-05
LRS breakdown
Kuli - automated influencer marketingAutomated influencer-marketing outreach and campaigns65.5›
Category. Marketing & Sales Tech
Scored in. 2026-06
LRS breakdown
AI-Powered Receipt Management AppScans and files receipts for expense and tax ops65.5›
Category. Accounting, Tax & Finance Ops
Scored in. 2026-06
LRS breakdown
SEO Audit and Recommendations PlatformAudits sites and recommends on-page SEO fixes65.5›
Category. Cloud & SaaS Infrastructure
Scored in. 2026-06
LRS breakdown
Cross-Platform Campaign OptimizerOptimizes ad campaigns across channels automatically64.9›
Category. Martech
Scored in. 2026-06
LRS breakdown
TelegrafOpen-source agent that collects server and app metrics64.5›
Category. Developer Tools & Infrastructure
Scored in. 2026-05
LRS breakdown
MindvaultsPersonal knowledge vault for notes and ideas64›
Category. Productivity & Collaboration
Scored in. 2026-05
LRS breakdown
Image Labeling Tool for Open DatasetsLabeling tool and marketplace for ML training data63.9›
Category. Marketplaces & Platforms
Scored in. 2026-05
LRS breakdown
Willow Scribe - Voice-to-text Mac appVoice-to-text dictation app for Mac63.3›
Category. AI Productivity
Scored in. 2026-05
LRS breakdown
Social Media MarketingFreelance social-media management and content61.5›
Category. In-Demand Freelance
Scored in. 2026-03
LRS breakdown
Project ManagerFreelance project-management services60.7›
Category. In-Demand Freelance
Scored in. 2026-03
LRS breakdown
SEO SpecialistFreelance SEO optimization services60›
Category. In-Demand Freelance
Scored in. 2026-03
LRS breakdown
AI Learning PlatformAI-driven personalized learning and upskilling59›
Category. Education & Upskilling
Scored in. 2026-03
LRS breakdown
Low-Code Enterprise AI Application BuilderLow-code builder for enterprise AI apps56.5›
Category. No-Code / Low-Code
Scored in. 2026-04
LRS breakdown
AI Education Collaboration PlatformCollaborative AI tools for classrooms and teams55.9›
Category. Education & Upskilling
Scored in. 2026-04
LRS breakdown
Retail Visitor Analytics PlatformIn-store visitor analytics for retailers55.3›
Category. Data & Analytics
Scored in. 2026-04
LRS breakdown
SEO Content WorkspaceWorkspace for planning and writing SEO content54.8›
Category. Marketing & Sales Tech
Scored in. 2026-04
LRS breakdown
AI Marketing Automation PlatformAutomates marketing workflows end to end54.6›
Category. Marketing & Sales Tech
Scored in. 2026-04
LRS breakdown
Six public signals per idea (0-to-max each). A low score can still be a strong private-demand idea.
FAQ
What is a launch, an idea, and a business in this report?+
A launch is one dated product at one URL. An idea is the underlying concept, of which there are far fewer. A business is a launch that makes money, fewer still. The three counts are kept separate and never blended.
What actually separates a winning idea from a losing one?+
Search demand, by about 28 points, and it holds in every scored month. Urgency adds 17. Pain barely separates them, only 11. Willingness-to-pay separated winners through May then collapsed in June as the signal saturated, so demand is the durable moat.
Which sectors are over-hyped and which are underrated?+
AI and Automation and Developer Tools are loud and merely average. Cybersecurity, HR and hiring, Legal, Real Estate, and Productivity score high on almost no supply. The same pattern held in May, so it is structural.
Does a low Launch Readiness Score mean an idea is bad?+
No. A business-to-business idea with no public footprint scores low even when demand is real and contracted. A founder with signed letters of intent in that wedge has an edge the public score cannot see.
Why is the volume trend shown only for the launch platforms?+
Volume rose partly because coverage rose, so only same-source comparisons carry a trend claim. The launch platforms are the one source group with a long enough continuous history to trend honestly.
How often does Fluenta publish?+
Every week. Subscribe at fluenta.space to get the next data drop before the trend is obvious.
Cite this article
Researchers and journalists: this article is freely citable. Click to copy the academic-format reference for your bibliography or footnote.
Ivanov, O. (2026). The State of New Business Ideas: H1 2026. Fluenta. Retrieved from https://fluenta.space/resources/reports/state-of-new-business-ideas-h1-2026.
About the author

Oleg Ivanov
Co-founder & CEO, Fluenta
Oleg is co-founder and CEO of Fluenta. He spent the last decade shipping products across fintech, commerce, and AI tooling, and now leads Fluenta's work scoring startup ideas against 25 live market and social data feeds.
Related Resources
State of New Business Ideas
State of New Business Ideas 2026: 181,011 Launches Scored
New business ideas 2026, measured: 181,011 launches from 74 sources, scored on the Launch Readiness Score. Which sectors buyers open, where AI stopped paying.
Agent Loops
Agent Loops: 15 AI Agent Business Ideas Ranked by Demand
The Claude loops trend reached 13.6M people in two weeks. Fluenta scored 15 agent-loop business ideas on live demand data: one promising, fourteen experimental.
LRS Report
50 Best Business Ideas for 2026, Scored by Demand Data
The best business ideas for 2026, scored by real demand data. Fluenta ranks 50 ideas 0 to 100 on Launch Readiness across six signals. See the top picks.
Score your idea in 20 minutes
Run Fluenta X-Ray on your idea. 25 live market + social feeds. Real demand data, real competition, real willingness-to-pay signals. From $7. 20 minutes.
Was this helpful?