State of New Business Ideas: May 2026
The state of new business ideas in May 2026 is a Busy market: we classified 4,092 fresh ideas from 74 sources, the Demand Index opened at 57, and AI made up 38% of all supply but only 10% of what founders actually saved to validate. This report ranks the over-hyped and underrated sectors and names the one signal that separates fundable ideas from noise. For the ideas scoring highest right now, see our top 50 business ideas report.
Key Takeaways
The headline numbers for May 2026 sit below.
BIDI, the Business Idea Demand Index, opened at 57. That puts May in the Busy band. BIDI is a single 0-to-100 score for the health of the idea market, built from the same rubric as our Launch Readiness Score. The full formula is at the end of this report.
Busy means the idea market is full of fresh ideas with real demand underneath them, but very few come with proof that anyone will pay. So this is a good month to find an idea and a hard month to fund one. The winning move is to compete on evidence of payment, not on novelty, because the crowd is all chasing the same thing.
The macro backdrop is why. Building has become cheap, so the idea itself is no longer the scarce asset, as one founder put the wider shift in May:
“AI is commoditising competence itself. This creates what I describe as the great commoditisation event.”
That shift shows up directly in the month's numbers.
May produced thousands of mostly new ideas, the market piled into AI agents, and one hard truth held everywhere. Everyone can find pain. Almost nobody proves someone will pay.
Fluenta Research, State of New Business Ideas, May 2026
The Demand Index turns it into one number.

Source · Fluenta BIDI, May 2026
57 is the baseline. Every future month moves up or down against it, and the band it lands in tells a founder how to play.
| BIDI band | Range | What the market is doing | What a founder should do |
|---|---|---|---|
| Quiet | under 40 | Thin and stale. Few new ideas, weak pull. | Go deep on an unglamorous niche. Little competition for attention. |
| Stirring | 40 to 55 | Waking up. More ideas, still unproven. | Validate hard before committing. Lots of noise, little signal. |
| Busy (May) | 55 to 70 | Rich in fresh ideas and demand, thin on payment proof. | Pick on proof someone pays, not novelty. Avoid the crowded squares. |
| Flood | 70+ | Frothy. Everything looks fundable, which is the trap. | Differentiate on distribution and willingness to pay. |
How May was collected
Fluenta scans new business ideas continuously, sorts every one into a 24-sector map, and deep-scores a curated slice on the Launch Readiness Score (LRS), a 0-to-100 rubric measuring how ready an idea is to launch. Here is the month, top to bottom: 4,092 ideas collected and classified, 3,744 left after we collapse repeats, 386 deep-scored, and an average LRS of 47. May drew on 74 active sources, out of more than 900 publishers we track.
The set narrows hard on purpose. We only collapse the same idea reworded inside the same source. When two different sources surface the same concept, we keep both, because that repetition is a signal we report later, not noise. Product Hunt is exempt from collapsing, since rival founders legitimately ship competing products there.
| Stage | Count |
|---|---|
| Collected and classified | 4,092 |
| Unique after de-dup | 3,744 |
| Deep-scored on LRS | 386 |
| Average LRS | 47 / 100 |
| Publishers tracked for ideas | 900+ |
| Sources behind the scored set | 74 |
Where ideas came from
May's ideas came overwhelmingly from two kinds of place: launch platforms where founders ship in public, and the research desks that publish what they think is coming next. Launch platforms alone were more than a third of the month. That matters because the type of source shapes the type of idea: launch platforms surface real shipping products, research and consulting surface narrative themes, and the two behave very differently when you score them later. So weight the loud sources accordingly: the feed leans toward what gets published and launched, not toward what quietly makes money.

Source · Fluenta, May 2026
Every source feeds the same few sectors
The more useful question is not how many ideas each source produced, but whether the sources agreed. They did. Trace each source's ideas into the sectors they fall in, and the flow is lopsided: every source, from Product Hunt to YC to McKinsey to BCG, sends most of its output into AI. AI alone takes more than half of all the flow shown, more than the next seven sectors combined. When nine separate sources all funnel into the same sector in the same month, that sector is not a secret edge anymore. It is the consensus trade, and you should expect it to be the most crowded place to build.

Source · Fluenta, May 2026
The crowded middle
Sectors are coarse; the sharper test is whether the same specific idea keeps surfacing in unrelated places. It does. Sixteen concepts stand out, from supply-chain tracking and stablecoin rails to persistent agent memory and AI drug discovery, each surfaced by three or more sources in May. Convergence cuts both ways: it means the demand is real, but it also means the idea is already crowded, so read this as a map of competition, not opportunity. If your idea sits here, assume a hot, contested category and bring a sharp wedge and a distribution edge, or pass. If you have real demand evidence for something absent here, that negative space is your contrarian lane.

Source · Fluenta, May 2026
The supply mix
Across all 4,092 ideas, the market's output is lopsided. AI and Automation is 38% of everything, larger than the next ten sectors combined. After that the curve drops fast: marketplaces, fintech, healthcare, robotics, and developer tools each sit between 5% and 8%, and a long tail of two dozen sectors splits the rest. That concentration is the headline supply fact of the month, and it sets up the gap we measure later: the market makes a great deal of one thing, and founders are quietly trying to validate something else.

Source · Fluenta, May 2026
The most-repeated concepts
This is a different lens from the sector mix, not a breakdown of it. We scan all 4,092 ideas for recurring concepts, where one idea can match several keywords or none, and count how often each appears. The question is no longer which industry, but which specific idea the market keeps repeating. One concept towers over the rest. The phrase "AI agent" appears in 194 ideas, the single most-repeated concept of the month, surfaced by nearly every source. Most of these agent ideas are infrastructure and runtime, the picks and shovels, not finished applications. The market is racing to lay rails before there are trains to run on them.
For a founder, this cuts both ways. A repeated concept confirms a real wave, and it warns you the obvious version is already overcrowded. The opportunity is rarely the agent itself. It is the unglamorous tool the agent needs.

Source · Fluenta, May 2026
The scored picture
Now the 386 deep-scored ideas, the curated slice we put through the full Launch Readiness Score. This is where the report stops counting ideas and starts judging them.
The ten ideas that scored highest
These ten scored highest on May's LRS, and they share a signature: each pairs real search demand with proof that someone pays, the two signals that actually separate winners.
| Idea | Sector | LRS | Why it scored |
|---|---|---|---|
| Open Vibe | AI and Automation | 66 | Top demand of the month plus full payment proof |
| Telegraf | Developer Tools and Infrastructure | 64 | Proven paid usage, strong search demand |
| Mindvaults | Robotics, Hardware and IoT | 64 | Strong demand with full payment proof |
| Image Labeling Tool for Open Datasets | Marketplaces and Platforms | 64 | High pain and easy to build |
| Willow Scribe | AI and Automation | 63 | Full payment proof, clear use case |
| Influencer Marketplace Platform | Marketing, Sales and Creator | 63 | Strong demand in an under-supplied sector |
| Image Compressor | Developer Tools and Infrastructure | 63 | High demand, trivial to build |
| One-click open-banking checkouts | Fintech, Banking and Insurance | 62 | Easiest build on the board plus high demand |
| Superset | AI and Automation | 62 | Highest demand among agent ideas, full payment proof |
| DeepCleanAudio | AI and Automation | 62 | Highest pain plus full payment proof |
Those ten are the shortlist worth studying this month.
The shape of quality
The scored ideas average LRS 47, and the distribution is a bell sitting just below the build-line: a thick middle in the 40s, a small killed tail under 32, and a thin top above 60. Most ideas are not bad and not great. They are mediocre, clustered right where a founder has to decide whether mediocre is worth a year of their life. The practical read is that the average idea is a coin flip you should decline. The work is finding the right tail.

Source · Fluenta, May 2026
What actually separates a winner
Every idea is scored on six dimensions. The most useful read in the report is what the 18 winners (LRS 60+) have that the 33 losers (under 35) do not.
| Dimension, percent of max | All | Winners 60+ | Losers under 35 |
|---|---|---|---|
| Pain | 69% | 73% | 63% |
| Demand (search) | 61% | 79% | 46% |
| Buildability (entry) | 60% | 60% | 64% |
| Fundability | 42% | 42% | 27% |
| Urgency | 50% | 56% | 38% |
| Budget-proof (payment) | 67% | 89% | 17% |
Pain barely moves between winners and losers. Almost every idea describes a real problem. What splits them is demand and budget-proof: winners are searched for and have evidence someone pays, losers have neither. So stop grading your idea on how painful the problem feels. Grade it on whether people are searching for a fix and whether anyone has paid for one.

Source · Fluenta, May 2026
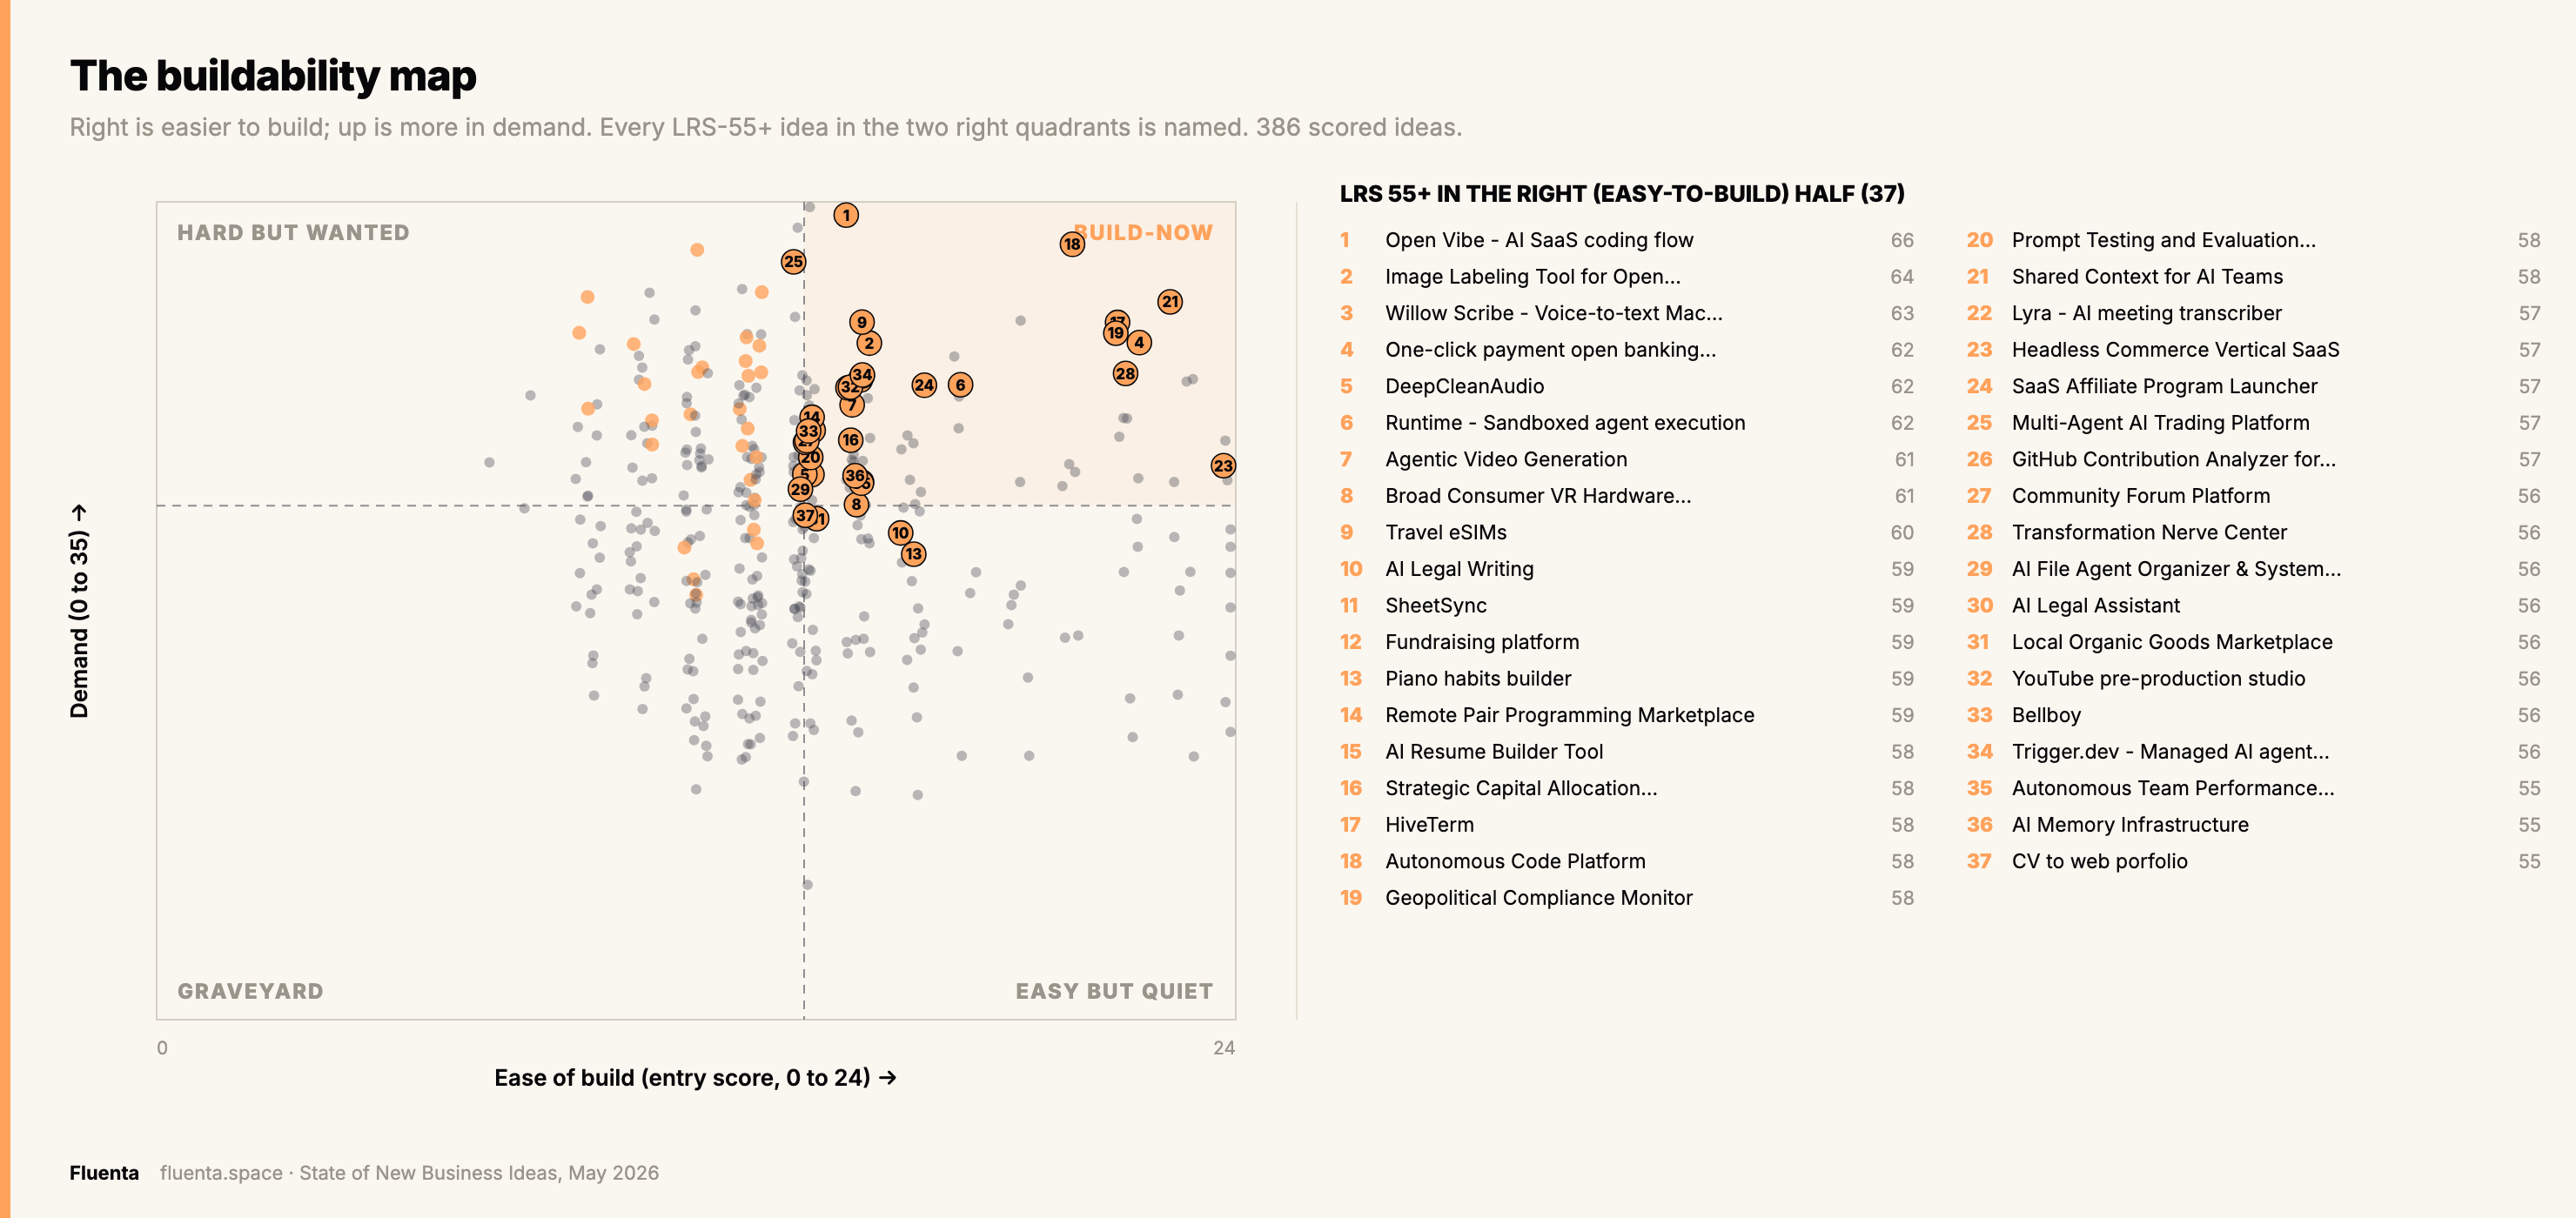
The buildability map
Two of the six dimensions answer the only question a builder asks first: can I build it, and does anyone want it? Plot every scored idea on ease of build against demand, draw a median crosshair, and four quadrants appear. The top-right, easy to build and in demand, is the Build-Now corner. The point is not the individual names. It is that the easy-and-wanted corner is thin. Most ideas are either hard to build or quiet, and a founder's edge is refusing to start anything that is not in that top-right corner.
Source · Fluenta, May 2026
The full scorecard behind every dot is one click away.
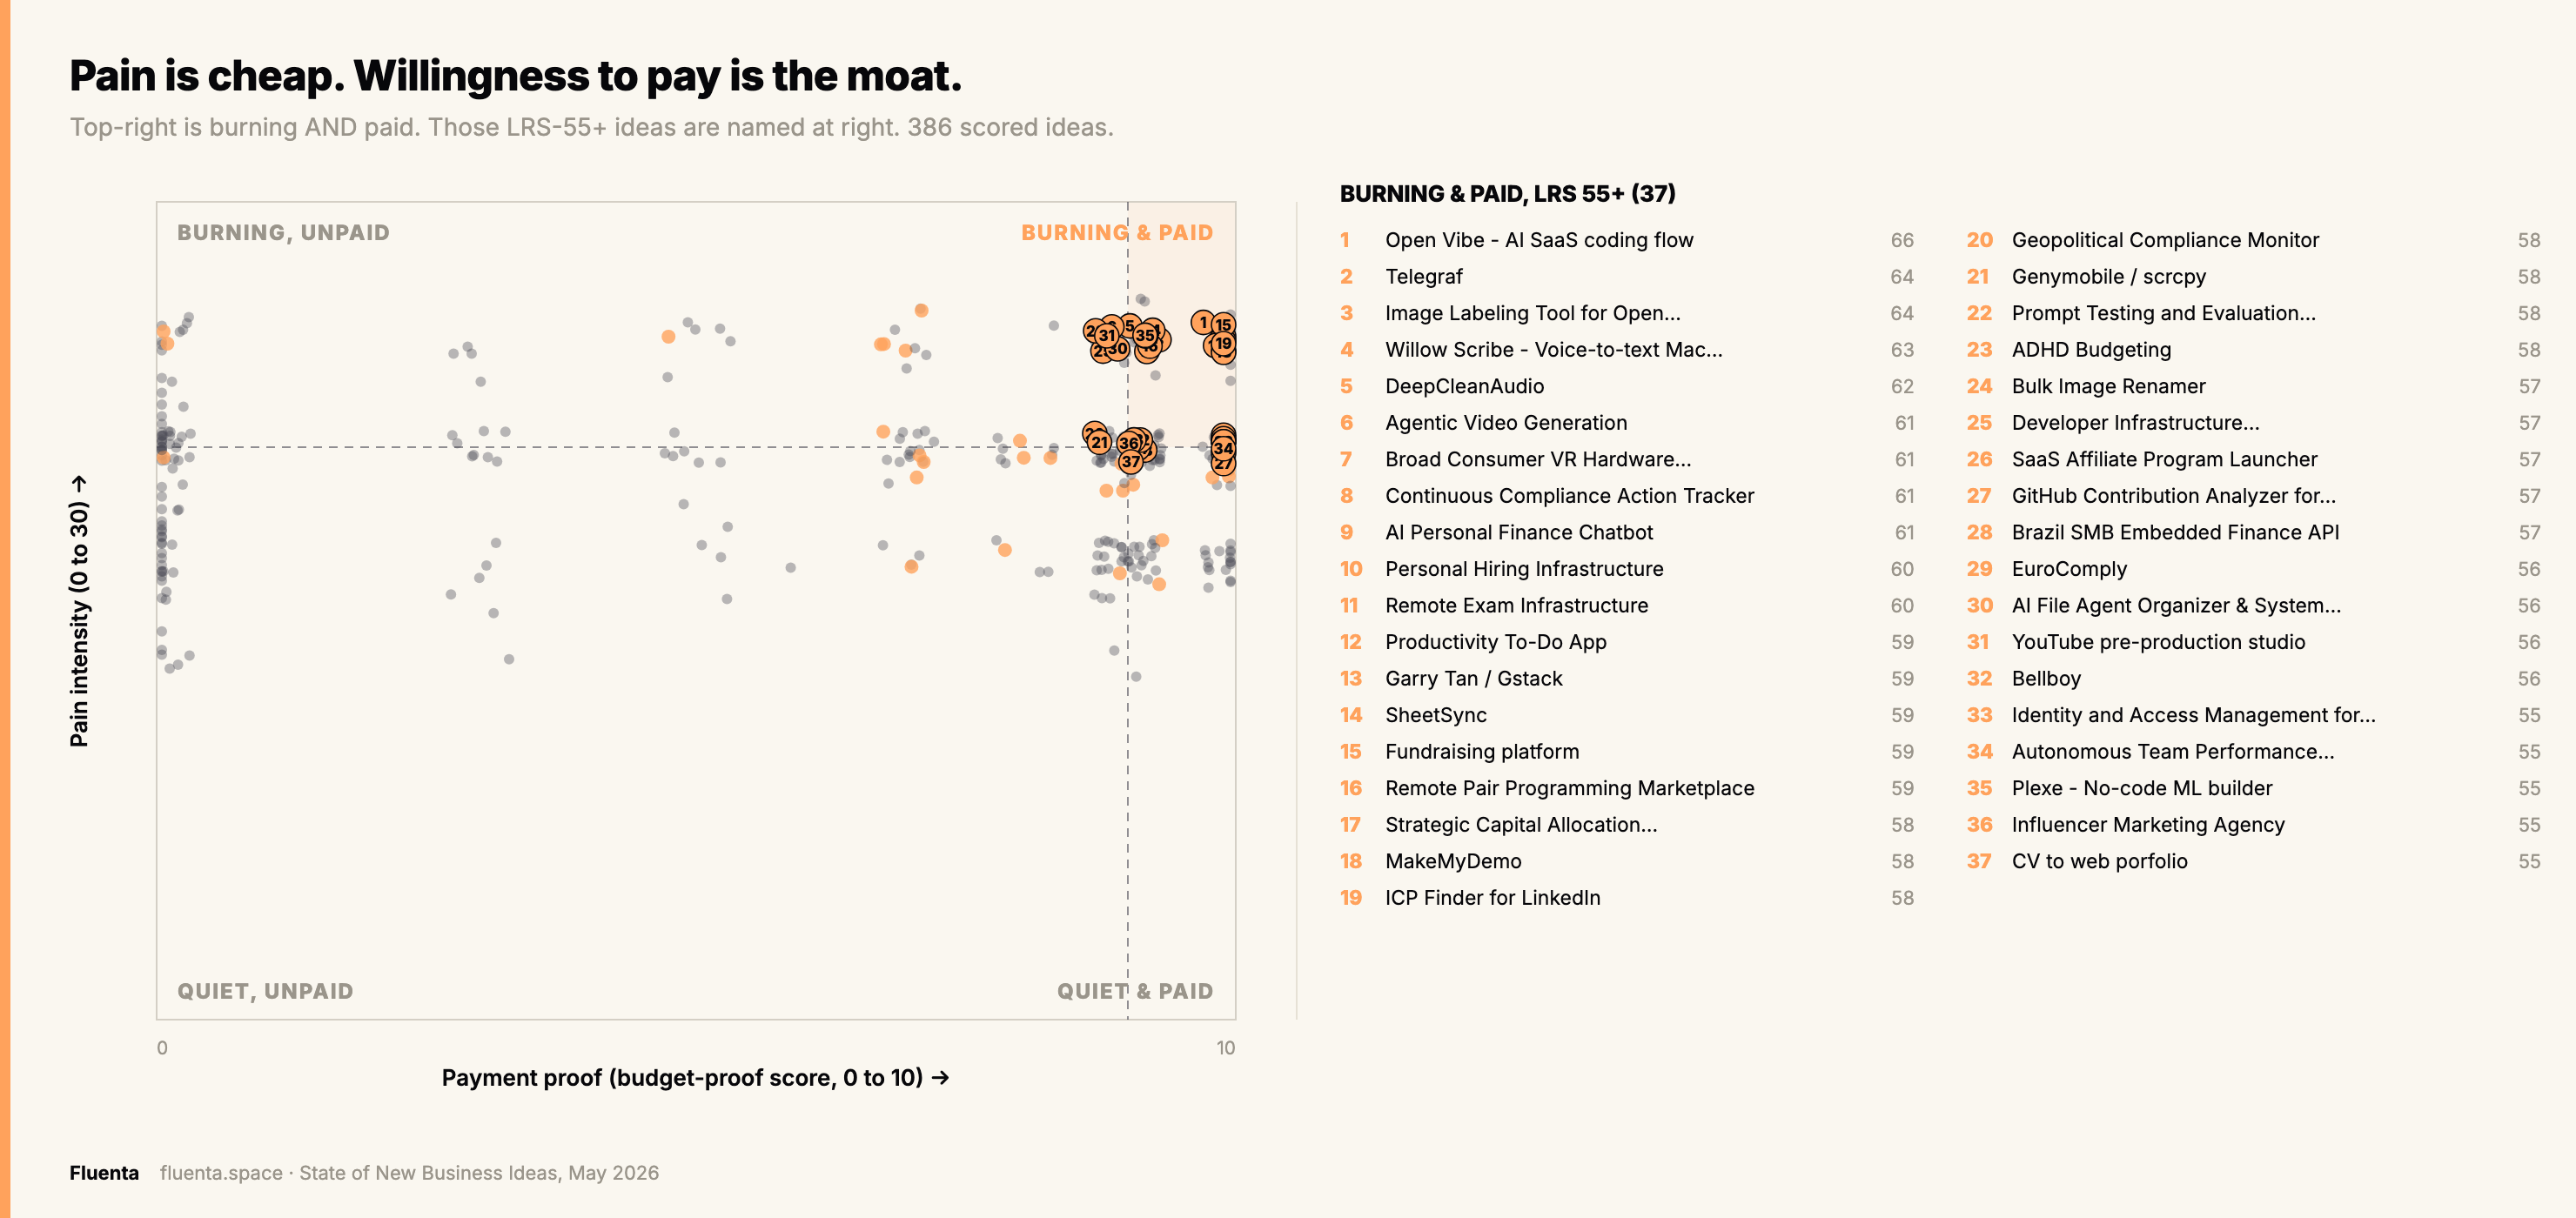
Pain is cheap. Willingness to pay is the moat.
Here is the trap the buildability map cannot show. Fluenta's X-Ray scores both how badly an idea's problem hurts and whether there is any proof someone pays to fix it. Cross the two and 26% of all scored ideas land in burning pain with weak payment proof: real problems nobody is actually paying to solve. That is the most expensive mistake a founder makes, because narrative pain feels like validation. It is not. Pain is table stakes. The scarce, deciding signal is proof of payment: winners average 89% on payment-proof, losers 17%.
“AI makes the one-person brand possible. It does not make bad judgment less dangerous.”
Before you build, find the two or three ideas where the pain is real and someone has already paid to relieve it. Those are the burning-and-paid ideas, the ones worth a year of your life.
Source · Fluenta, May 2026
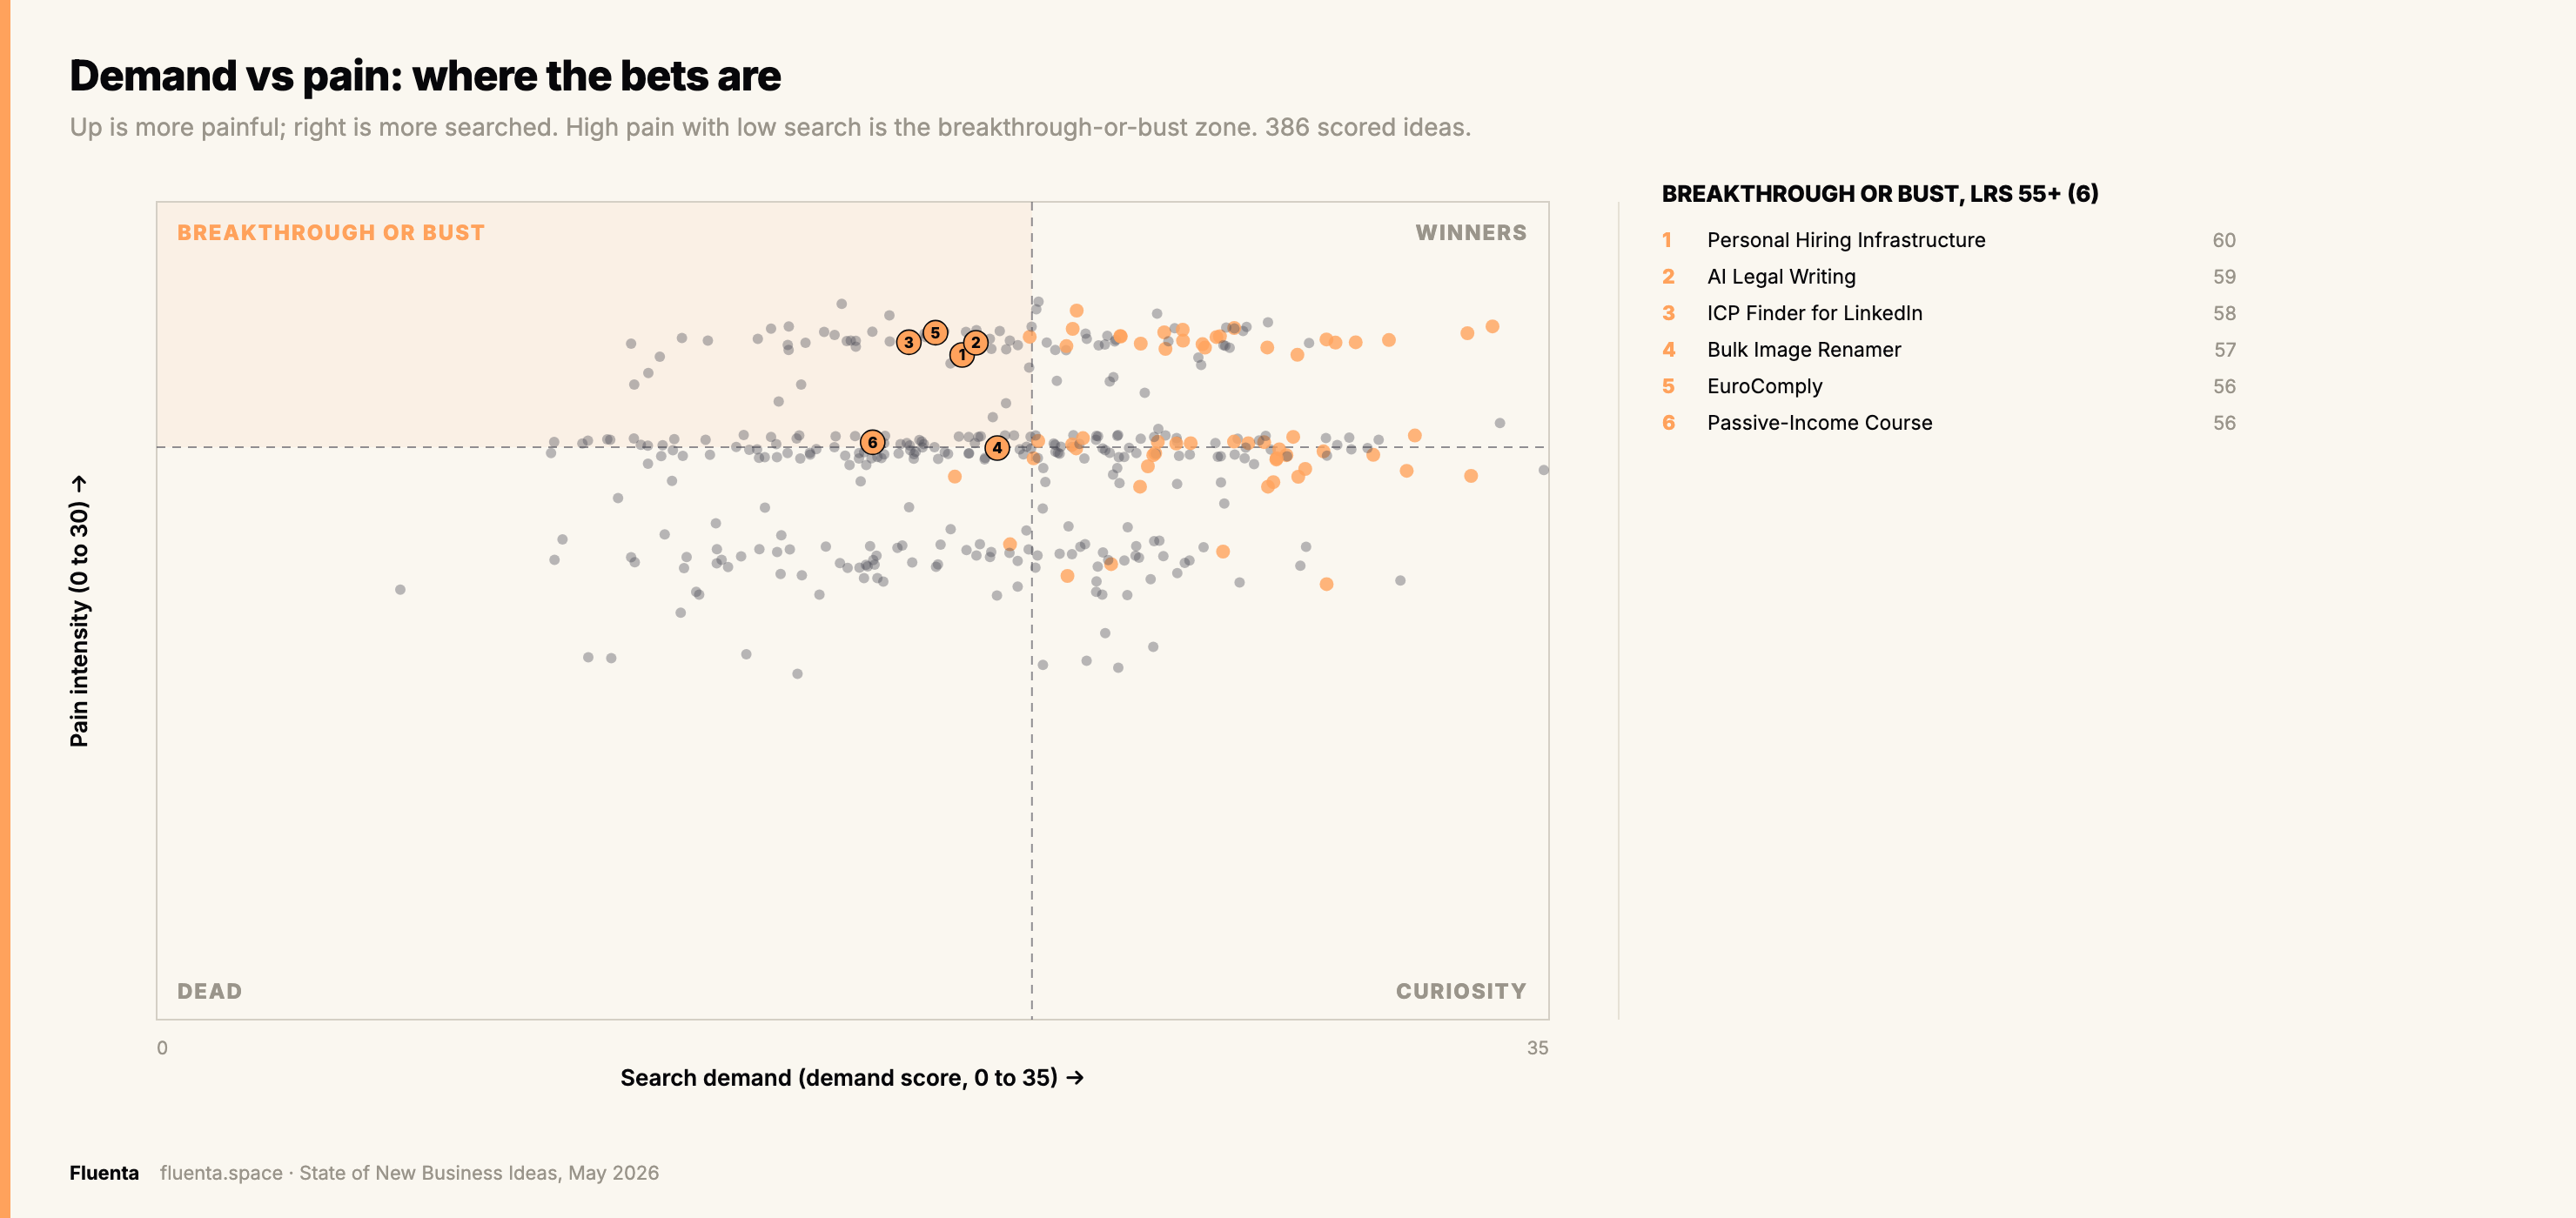
Breakthrough or bust: high pain, low search
One more quadrant is worth its own view. Plot demand against pain, and the top-left fills with ideas that are intensely painful but almost nobody is searching for. This is the breakthrough-or-bust square: a real, unmet problem the market has not yet learned to ask for. Low search can mean the problem is genuinely ahead of the market, where category-defining companies are born, or that nobody will ever look for it, which is a graveyard with good intentions. The two look identical on the chart. The only way to tell them apart is to talk to the people in pain and find out whether they are actively hunting for a fix or have given up.
Source · Fluenta, May 2026
Over-hyped and underrated sectors
Plot how much each sector floods the feed against the average quality of its scored ideas, and the loud-but-weak sectors separate cleanly from the quiet-but-strong. AI and Automation is the most over-hyped sector of the month by a wide margin: 38% of all supply, but an average LRS of just 46. Consumer, media, and crypto also land on the over-hyped side. On the other side sit the underrated sectors nobody is crowding: Legal and Compliance (LRS 53), HR and Hiring (53), Productivity (52), and Developer Tools (51). The move is uncomfortable but simple: build where the scores are high and the crowd is thin, not where the headlines are.

Source · Fluenta, May 2026
What the market makes vs what founders want
Early indicator, based on the first ideas founders saved in May. Read the direction, not the decimals.
Fluenta sees two things most idea lists cannot: what the market surfaces, and what founders actually save to validate. Lining them up exposes a real mismatch. AI is 38% of supply but only 10% of what founders saved. The sectors founders reach for, fintech, professional services, food and travel, consumer, and sales tooling, are barely present in the feed. If that gap holds, it is the clearest arbitrage in the report: the market is over-producing the one category founders are walking away from, and under-producing the categories they want.
A note on privacy. Fluenta reports only aggregate patterns. We never expose, sell, or share individual ideas or user activity, and we draw only on publicly surfaced ideas, never private pipelines. Demand is reported only above a minimum cohort size.
Fluenta Research
Back to the data: supply and demand do not line up.

Source · Fluenta, May 2026
The BIDI, and exactly how it is built
The Business Idea Demand Index is one 0-to-100 number for the health of the idea market, built from the same rubric as LRS so it never drifts from it. It blends four market-level sub-indices.
BIDI = 0.40 x Quality + 0.25 x Demand + 0.20 x Monetizability + 0.15 x Novelty
| Sub-index | What it measures | May |
|---|---|---|
| Quality (40%) | Average LRS of all scored ideas | 47 |
| Demand (25%) | Average demand dimension, percent of max | 61 |
| Monetizability (20%) | Average of funding plus budget-proof | 55 |
| Novelty (15%) | Percent of concepts net-new vs prior months | 84 |
0.40 x 47 + 0.25 x 61 + 0.20 x 55 + 0.15 x 84 = 18.8 + 15.3 + 11.0 + 12.6 = 57.5, which rounds to 57. That puts May in the Busy band (55 to 70): rich in fresh ideas and decent demand, held back by low fundability and thin proof of payment. High novelty, average quality, exactly the signature of a Busy market. Plenty to find, hard to fund.
How to play each band
Founders build in every market, so the question is never whether to build but where to aim, and each band rewards a different focus. Cold, under 40: the wave has not formed, so go narrow and deep on an unglamorous niche you can own outright, and build for one reachable buyer rather than a trend. Stirring, 40 to 55: the market is waking but unproven, so validate ruthlessly before you commit a quarter; the trap is mistaking early noise for real demand. Busy, 55 to 70, where May sits: the wave is rising and the obvious ideas are already crowded, so a sharp wedge and a distribution edge you actually own are the whole game, and you win on proof of payment, never on novelty. Flood, 70 and up: everything looks fundable, which is the trap, so differentiate on willingness to pay and a channel you control, because discipline and a defensible niche beat speed.
The takeaways, inverted
Advice is easy to nod along to and forget. So here is the report inverted: the four moves that, on this month's data, most reliably burn six months in vain. Each comes with the escape.
1. Ship another AI agent. It is the most crowded square on the board and only average quality, so you arrive late with no edge. Escape: if you build in AI, build the boring tool the agents depend on, find a wedge and a deep specialization angle nobody else is serving, not a tenth agent.
2. Treat pain as proof. Pain is high almost everywhere, which is exactly why it cannot tell winners from losers. Escape: before committing, confirm two harder things, that people are searching for a fix and that someone already pays for one.
3. Optimise for the demo, not the invoice. A quarter of ideas are burning problems nobody pays to solve, and they feel like validation right up until launch. Escape: try to charge one real customer in week one, not month six.
4. Marry a hard idea. Only a thin slice are both easy to build and wanted; everything else is a time tax you volunteered for. Escape: choose from that slice on purpose, and let the attachment come after the evidence.
If you want it in one line: avoid the crowd, demand proof of payment, and only start what is easy to build and clearly wanted.
What is next
The Index sharpens as sources grow, and June already expanded to include the App Store, Bain, KPMG, Harvard Business Review, Stanford GSB, Accenture, Deloitte, General Catalyst, Index Ventures, PitchBook, Forrester, Gartner, Modern Retail, Fast Company, Lightspeed, Bessemer, Seedtable, BetaList, npm, PyPI, Freelancer, and We Work Remotely. Source mixes rotate month to month, so read month-to-month comparisons with that in mind.
Don't miss next month's edition
Score your own idea free and get its LRS and six-dimension profile, plus the monthly State of New Business Ideas, the weekly Top Trending Ideas, and the Saturday Idea Kill List.
Free. Subscribing creates your Fluenta account so you can score your own ideas too.
Methodology
Based on 4,092 ideas classified from the May 2026 collection across 74 active sources, out of more than 900 publishers in the full registry. Every remaining idea was sorted into a 24-sector taxonomy with none left unlabeled; 3,744 survive same-source de-duplication; 386 were deep-scored 0-to-100 on the LRS rubric across six dimensions (pain, demand, buildability, fundability, urgency, budget-proof). De-duplication collapses same-source reworded repeats only; cross-source recurrence is kept as a signal. Net-new is measured against March and April.
| Term | Meaning |
|---|---|
| LRS (Launch Readiness Score) | A 0-to-100 score of how ready an idea is to build, combining six dimensions. |
| BIDI (Business Idea Demand Index) | A 0-to-100 monthly index of the idea market's overall health. |
| Pain | How acute the underlying problem is. |
| Demand | Search interest and market pull for a solution. |
| Buildability (entry) | How easy an idea is to build and enter; lower barrier scores higher. |
| Budget-proof | Evidence that someone actually pays to solve the problem. |
| Novelty (net-new) | Share of this month's ideas not seen in prior months. |
Sources
Fluenta May 2026 idea collection: 4,092 ideas classified across 74 active sources (900+ publisher registry)
386 Fluenta X-Ray deep-scores, May 2026
Fluenta Launch Readiness Score rubric (six dimensions)
Matteo Turi, "The Founder Extinction Event," The High Valuation Code, 2026-05-24
Rai Nausherwan Nazar, "Taste Is the Moat," 2026-05-17
Log in to Fluenta to open the full scorecard behind every highlighted idea →
FAQ
What is the BIDI?+
The Business Idea Demand Index, a single 0-to-100 score for the health of the idea market, blending quality, demand, monetizability, and novelty. May opened at 57, in the Busy band.
What was the most over-hyped startup sector in May 2026?+
AI and Automation: 38% of all ideas surfaced, but only average quality (LRS 46) and just 10% of what founders actually try to validate.
What separates a fundable idea from a dead one?+
Not pain. Across 386 scored ideas, winners and losers both describe real problems. What separates them is search demand and proof someone pays: winners average 89% on payment proof, losers 17%.
Which startup sectors are underrated right now?+
Legal and Compliance, HR and Hiring, Productivity, and Developer Tools all score well above their volume: high quality, low crowd.
What are the top business ideas of May 2026?+
The ten highest-scoring include Open Vibe, Telegraf, Mindvaults, an open-dataset image-labeling marketplace, and Willow Scribe. See the Top 10 table in the report.
How is the data collected?+
Fluenta scanned 4,092 ideas from 74 sources, classified them into 24 sectors, and deep-scored 386 on a six-dimension rubric (pain, demand, buildability, fundability, urgency, budget-proof). See Methodology.
Cite this article
Researchers and journalists: this article is freely citable. Click to copy the academic-format reference for your bibliography or footnote.
Ivanov, O. (2026). State of New Business Ideas: May 2026. Fluenta. Retrieved from https://fluenta.space/resources/reports/state-of-new-business-ideas-may-2026.
About the author

Oleg Ivanov
Co-founder & CEO, Fluenta
Oleg is co-founder and CEO of Fluenta. He spent the last decade shipping products across fintech, commerce, and AI tooling, and now leads Fluenta's work scoring startup ideas against 25 live market and social data feeds.
Related Resources
Validation
How to Validate a SaaS Idea in 2026 (Without Asking Your Friends)
Most validation advice is therapy. This is the only sprint that kills your idea with money — a 6-stage, 72-hour framework for solo & small-team founders, built on commitment signals from strangers. CB Insights-grade data, CEO-authored.
Founder Playbook
Customer Discovery Playbook: 12 Interview Scripts (2026)
12 customer discovery scripts tested across 47 founder interviews. Copy-paste ready. The exact questions that surface real demand vs polite lies.
Report
YC Spring 2026 Batch: All 194 Companies, Scored
We scored every company in YC's Spring 2026 batch on six public signals before Demo Day. The findings, the four groups, and a searchable board of all 194 with the questions each founder will get asked.
Score your idea in 20 minutes
Run Fluenta X-Ray on your idea. 25 live market + social feeds. Real demand data, real competition, real willingness-to-pay signals. From $7. 20 minutes.
Was this helpful?