Startup Statistics 2026: 52 Numbers From 235,039 Launches

Every number on this page comes from one place. Between August 2025 and June 2026, Fluenta logged 235,039 dated business-idea launches across 146 sources, then scored 1,238 of those ideas on six live market signals. The narrative version lives in The State of New Business Ideas: H1 2026. This page is the reference cut: the numbers, sourced, in one place. The citation format sits at the bottom, and every chart is free to republish with attribution.
Key Takeaways
The top 10 startup statistics for 2026
Ten numbers, one table. Every one is unpacked and sourced further down the page.
| The number | The fact |
|---|---|
| 235,039 | Business-idea launches tracked across 146 sources, August 2025 to June 2026 |
| 3x | Product Hunt monthly launches, from about 7,300 to about 21,600 in ten months |
| 14.6% | SaaS ideas that are both fundable and uncrowded, of 130 scored in Q2 2026 |
| 57% | Market saturation the median new SaaS idea walks into |
| 28 points | How far search demand separates top-fifth ideas from bottom-fifth, every month |
| 34.8% | AI-native ideas defensible for a new entrant: 31 of 89 |
| 12 of 12 | Killed ideas where urgency failed; demand failed in 11 of 12 |
| 48.7 of 100 | Average YC Spring 2026 launch-readiness score on public signals |
| 275 | Monthly searches for the typical trend-spotted business idea |
| 50.4 to 54.3 | Business Idea Demand Index, March to June 2026, rising |
How many startups launch in 2026
235,039 dated business-idea launches were collected between August 2025 and June 2026 in the Fluenta index, across 146 launch, funding, and discussion sources. Nobody has assembled a bigger public record of what actually got shipped, pitched, and argued about.
Product Hunt nearly tripled in ten months. About 7,300 launches in August 2025. About 21,600 in June 2026. It is the one source with an unbroken monthly record, and the step change landed in March.
The wave is rotating. From January to June 2026, Productivity and Collaboration gained 4.1 points of launch share and Marketing and Creator gained 2.6, while Developer Tools lost 3.8 and generic AI and Automation lost 3.4. Tools for builders are ceding the launch wave to tools for work. Quietly, but in every month of data.
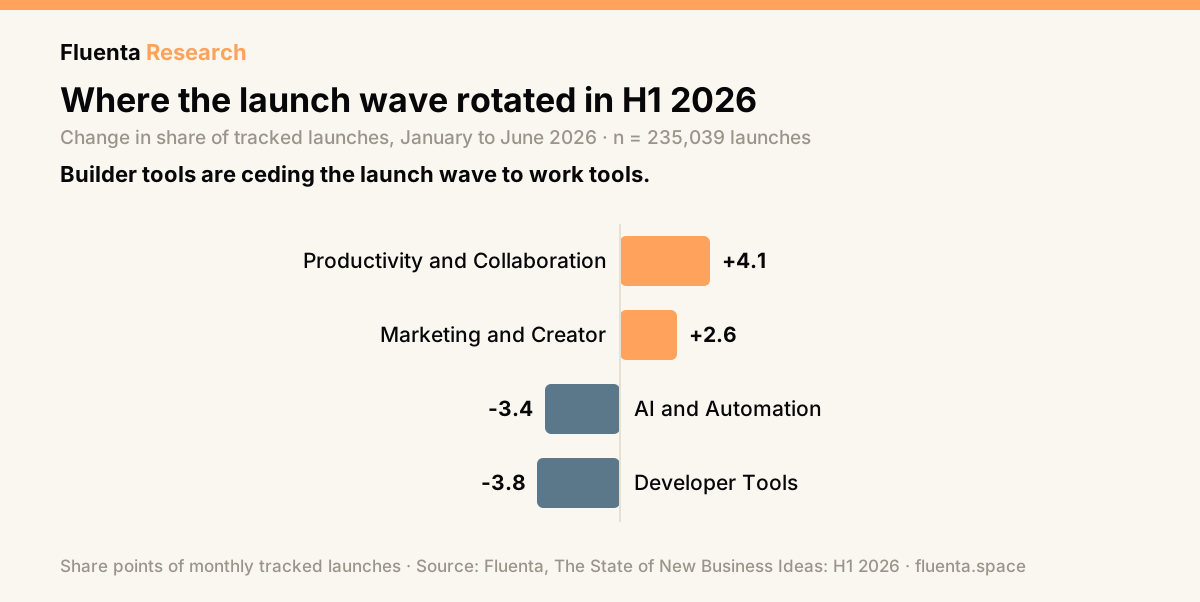
Embed this chart, free with attribution. Copy this snippet: <a href="https://fluenta.space/resources/guides/startup-statistics"><img src="https://studio.fluenta.space/api/media/file/ss26-sector-shift-v1.svg" alt="Launch share rotation January to June 2026, Fluenta data" width="100%"/></a> Source: Fluenta, Startup Statistics 2026
Startup failure statistics
A note on method first: these failure numbers come from scoring, not surveys. Each idea gets graded on six live signals: demand, pain, urgency, competition, monetization, funding. Score under 32? At least two signals failed outright.
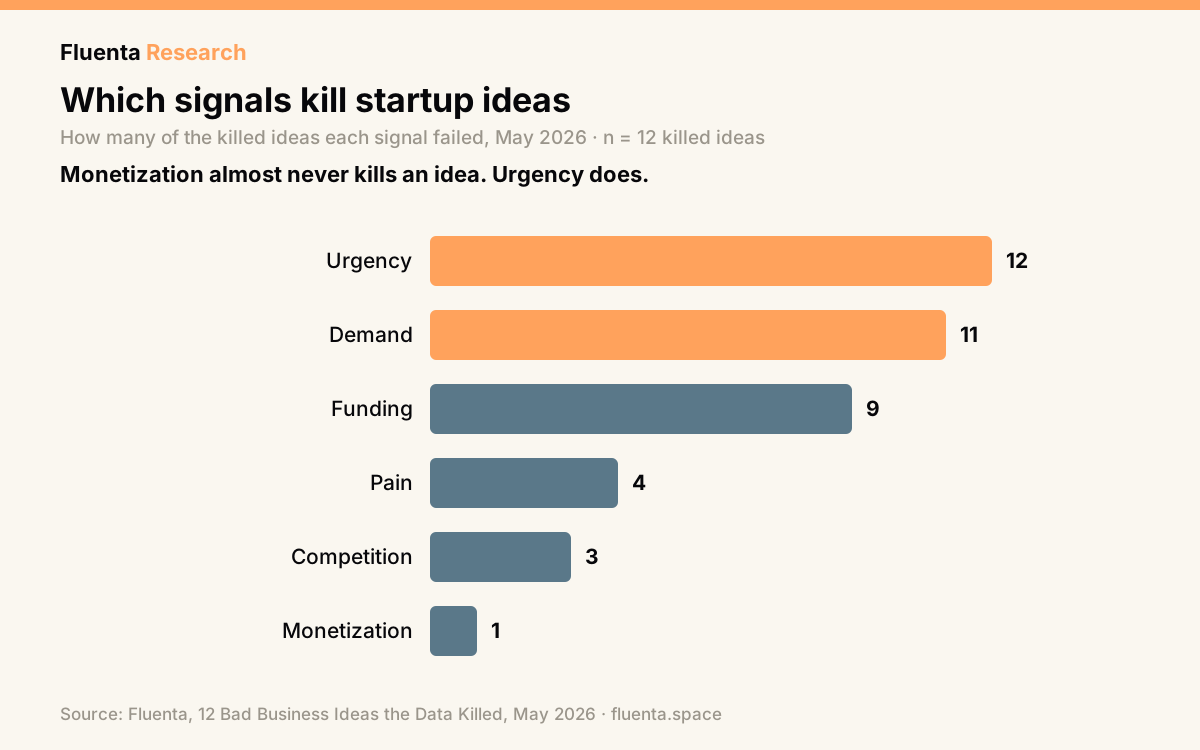
Embed this chart, free with attribution. Copy this snippet: <a href="https://fluenta.space/resources/guides/startup-statistics"><img src="https://studio.fluenta.space/api/media/file/ss26-kill-signals-v2.svg" alt="Which signals kill startup ideas, Fluenta data, May 2026" width="100%"/></a> Source: Fluenta, Startup Statistics 2026
90.7% of ideas die before scoring even begins. Of 4,238 idea mentions scouted from 74 active sources in May 2026, only 393 were distinct and serious enough to score.
Urgency failed in 12 of 12 killed ideas. Demand failed in 11. The two cheapest signals to check do nearly all the killing.
Monetization killed just one. Funding appetite failed in 9 of 12, pain in 4, competition in 3. Almost every dead idea could have made money, if anyone had needed it.
Read this twice: the killed cohort sat CLOSE TO AVERAGE on pain, and far below average on urgency, demand, funding, and monetization. Ideas rarely die because the pain is fake. They die because nobody is in a hurry to pay.
Six weak signals in one week has no survivors. Six independent signals reading weak in the same week is the cleanest failure-guaranteed pattern in the dataset.
Public sources tell the same story one stage later. Per US Bureau of Labor Statistics survival data, roughly one in five US businesses closes in its first year and about half are gone within five. Per CB Insights, the most cited reason startups fail is building something with no market need. Same disease, caught earlier here.
Market saturation statistics
130 SaaS ideas, scored in Q2 2026 on two axes: can this get funded, and is the market already full. Four quadrants fall out, and the good one is nearly empty.
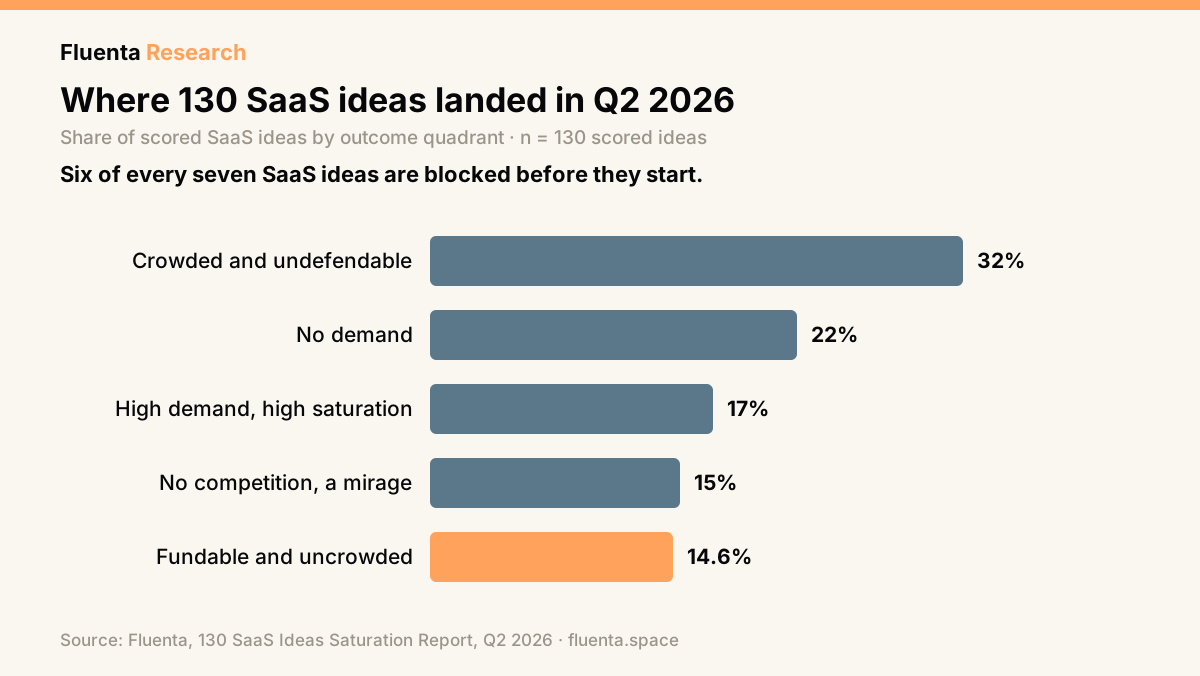
Embed this chart, free with attribution. Copy this snippet: <a href="https://fluenta.space/resources/guides/startup-statistics"><img src="https://studio.fluenta.space/api/media/file/ss26-saturation-quadrants-v2.svg" alt="Where 130 SaaS ideas landed in Q2 2026, Fluenta data" width="100%"/></a> Source: Fluenta, Startup Statistics 2026
The same picture as a table:
| Quadrant | Ideas | Share |
|---|---|---|
| Crowded and undefendable, the graveyard | 41 of 130 | 32% |
| No demand, fundability under 30 | 29 of 130 | 22% |
| High demand but high saturation, too late | 22 of 130 | 17% |
| No competition, a mirage | 19 of 130 | 15% |
| Fundable and uncrowded, the target | 19 of 130 | 14.6% |
The median idea walks into a market that is already 57% saturated. Before a line of code gets written.
Too late has a number, and the number is 70. Saturation above 70% marked every idea in the too-late group. And no competition is not the green light it looks like: 19 ideas with zero competitors turned out to have zero market.
AI startup statistics
Only 31 of 89 AI-native ideas are defensible for a new entrant. That is 34.8%. The other 58 split between ghost markets, where demand evaporates the moment anyone checks, and categories already too crowded to enter.
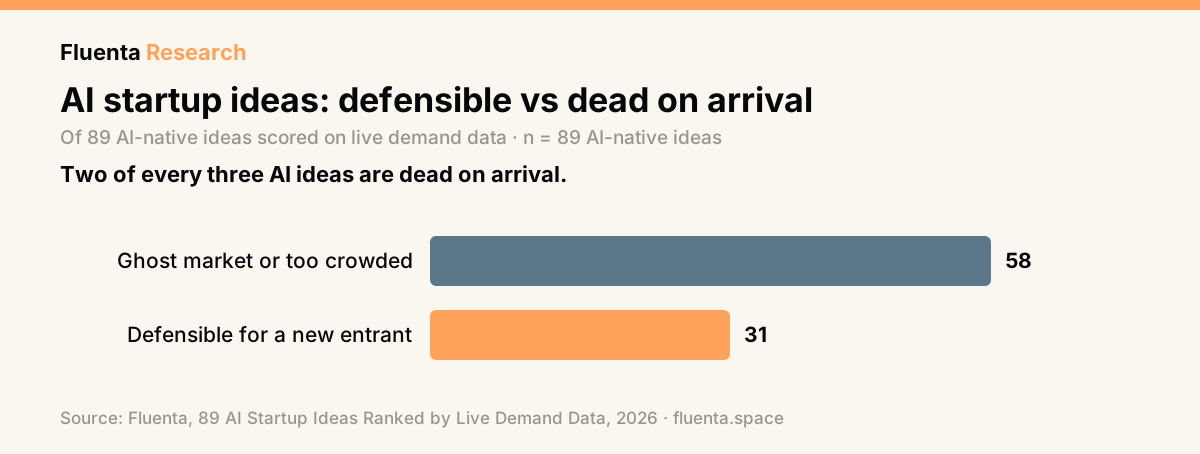
Embed this chart, free with attribution. Copy this snippet: <a href="https://fluenta.space/resources/guides/startup-statistics"><img src="https://studio.fluenta.space/api/media/file/ss26-ai-defensibility-v1.svg" alt="89 AI startup ideas, defensible vs dead on arrival, Fluenta data" width="100%"/></a> Source: Fluenta, Startup Statistics 2026
The market is not short on AI ideas. It is short on defensible ones. AI-native ideas made up 68% of the Q2 scoring cohort, and only a third of them were worth building.
The AI agents market is projected to grow 10x by 2030, from $5.26B in 2024 to $52.62B, a 46.3% compound annual rate. Vertical AI agents grow fastest at a projected 62.7% CAGR, well ahead of general-purpose agents.
Open weights move in days; closed models leave a gap. Gemma and Qwen spawn derivative launches on GitHub and Hugging Face within 0 to 3 days. Claude and GPT reach launch platforms in 1 to 6 days and leave Hugging Face empty.
A model release barely moves the market. A Claude release lifts launch activity by 1.07x on average. Sustained mindshare beats the release-day bump.
AI and Automation reads as over-hyped in the sector map: huge launch share, merely average quality. May showed the same split. June showed it again. That is a structure, not a blip.
YC Spring 2026 batch statistics
All 194 companies in the YC Spring 2026 batch, scored on six public signals before Demo Day. The company-by-company table lives in 194 YC Spring 2026 Startups, Scored on Public Data.
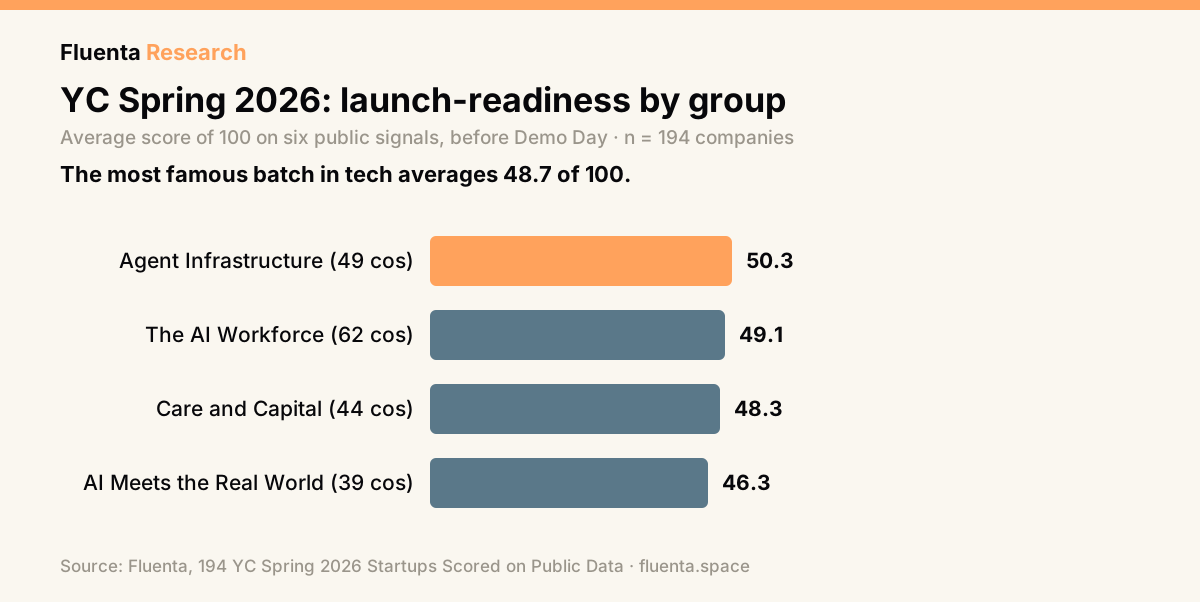
Embed this chart, free with attribution. Copy this snippet: <a href="https://fluenta.space/resources/guides/startup-statistics"><img src="https://studio.fluenta.space/api/media/file/ss26-yc-group-averages-v2.svg" alt="YC Spring 2026 launch readiness by group, Fluenta data" width="100%"/></a> Source: Fluenta, Startup Statistics 2026
Four demo-day groups, all of them AI. The AI Workforce with 62 companies, Agent Infrastructure with 49, Care and Capital with 44, AI Meets the Real World with 39. There is no non-AI YC anymore. The most common category: AI and Automation with 53 companies, then Developer Tools with 22, Healthcare with 18, Robotics with 17.
The averages sit in a four-point band. Agent Infrastructure 50.3, AI Workforce 49.1, Care and Capital 48.3, AI Meets the Real World 46.3. Batch average: about 48.7 of 100.
14 of 49 priced Agent Infrastructure companies need over a year to earn back one customer. Strong monetization scores, broken payback math.
18 of 19 health companies carry an FDA or reimbursement barrier that no public signal measures. The score cannot see the regulatory wall. The wall is still there. Meanwhile the Care and Capital monetization pillar averages 89%, because health and money businesses take a slice of transactions that already happen.
Even the best pre-Demo-Day profile in the world's most famous accelerator is a 65 of 100, not a 90. The top company earned it on 7,150 searches a month at 100% transactional intent and keyword difficulty 13: demand, not hype.
Trending business idea statistics
Scouts versus stats, the oldest argument in baseball, replayed with business ideas. The trend tools are the scouts. Here is what the stats said.
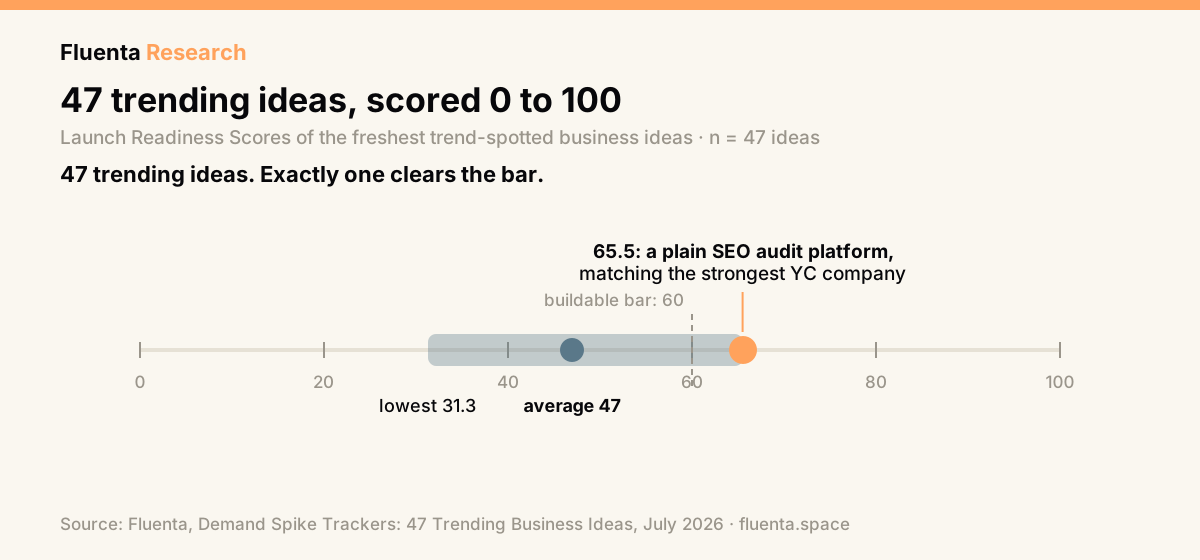
Embed this chart, free with attribution. Copy this snippet: <a href="https://fluenta.space/resources/guides/startup-statistics"><img src="https://studio.fluenta.space/api/media/file/ss26-trend-range-v1.svg" alt="Scores of 47 trending business ideas, Fluenta data" width="100%"/></a> Source: Fluenta, Startup Statistics 2026
47 trending ideas averaged 47 of 100 on the same rubric as the YC batch. Scores ran from 31.3 to 65.5, and exactly one idea cleared 60. Trending and buildable turn out to be different lists.
The typical trend-spotted idea draws 275 searches a month. Genuine. Early. Tiny.
The one that cleared the bar was a plain SEO audit platform. It scored 65.5, matching the strongest company in YC's entire Spring 2026 batch. The most buildable trending idea of the summer was a boring service with paying customers attached.
Search demand is the signal that separates winners. Across 1,238 ideas scored from March to June 2026, it split the top fifth from the bottom fifth by about 28 points, in every single month. No other signal came close. The Business Idea Demand Index, which compresses quality, demand, monetizability, and novelty into one monthly reading, rose from 50.4 in March to 54.3 in June.
The top three ideas of H1 2026: Python automation scripting at 66.2, an SEO content workflow engine at 66.2, an AI SaaS coding flow at 65.9. Boring, monetizable work beat frontier hype across the entire half. The ten highest, as a preview; the full top 20 with six-signal breakdowns lives in the H1 report:
| # | Idea | LRS | Category |
|---|---|---|---|
| 1 | Python Automation Scripting | 66.2 | In-Demand Freelance |
| 2 | SEO Content Workflow Engine | 66.2 | Martech |
| 3 | Open Vibe, AI SaaS coding flow | 65.9 | AI App Builders |
| 4 | Kuli, automated influencer marketing | 65.5 | Marketing & Sales Tech |
| 5 | AI-Powered Receipt Management App | 65.5 | Accounting, Tax & Finance Ops |
| 6 | SEO Audit and Recommendations Platform | 65.5 | Cloud & SaaS Infrastructure |
| 7 | Cross-Platform Campaign Optimizer | 64.9 | Martech |
| 8 | Telegraf | 64.5 | Developer Tools & Infrastructure |
| 9 | Mindvaults | 64.0 | Productivity & Collaboration |
| 10 | Image Labeling Tool for Open Datasets | 63.9 | Marketplaces & Platforms |
Methodology
Fluenta scores business ideas on six live market signals: search demand, audience pain, urgency, competition density, monetization, and funding appetite. This page aggregates 235,039 launches collected across 146 sources between August 2025 and June 2026. Within that record, 1,238 ideas were fully scored between March and June 2026. Cohort analyses cover 130 SaaS ideas from Q2 2026, 89 AI-native ideas, 47 trend-spotted ideas, 393 ideas scouted in May, and all 194 YC Spring 2026 companies. Scores use public data only, which cuts both ways: a company with quiet public signals and signed private pilots can score low. The scores measure market evidence, not team quality.
How to cite this page
Source: Fluenta, Startup Statistics 2026. fluenta.space/resources/guides/startup-statistics
Every chart on this page is free to republish with a link to this page as attribution. The reports behind each section carry the full datasets: the H1 2026 record, the saturation report, the AI ranking, the YC batch scores, the kill list, and the trend tracker.
Changelog: July 2026, page created from the H1 2026 dataset.
FAQ
How many startups launch per month in 2026?+
Product Hunt alone carried about 21,600 launches in June 2026, up from about 7,300 in August 2025. Across all 146 tracked sources, Fluenta collected 235,039 dated launches between August 2025 and June 2026.
What percentage of startup ideas are viable in 2026?+
Only 14.6% of SaaS ideas scored in Q2 2026 were both fundable and uncrowded, and only 34.8% of AI-native ideas were defensible. The most common outcome is entering a market that is already crowded and undefendable, which captured 32% of ideas.
What are the top startup ideas for 2026?+
By Launch Readiness Score, the top ideas of H1 2026 were Python automation scripting at 66.2, an SEO content workflow engine at 66.2, and an AI SaaS coding flow at 65.9. Practical, monetizable work beat frontier hype.
Why do most startup ideas fail?+
Urgency and demand do almost all the killing. Urgency failed in 12 of 12 killed ideas and demand in 11 of 12, while monetization failed in only 1. Ideas rarely die because they cannot make money. They die because nobody needs them now.
How strong is the YC Spring 2026 batch?+
Scored on public signals before Demo Day, the 194 companies average about 48.7 of 100, with group averages between 46.3 and 50.3 and the strongest company in the mid-60s.
Is AI startup demand still growing in 2026?+
Yes, but unevenly. The AI agents market is projected to grow at a 46.3% CAGR to $52.62B by 2030, yet generic AI and Automation lost 3.4 points of launch share from January to June 2026. Vertical, specialized applications are where growth and defensibility overlap.
Cite this article
Researchers and journalists: this article is freely citable. Click to copy the academic-format reference for your bibliography or footnote.
Ivanov, O. (2026). Startup Statistics 2026: 52 Numbers From 235,039 Launches. Fluenta. Retrieved from https://fluenta.space/resources/guides/startup-statistics.
About the author

Oleg Ivanov
Co-founder & CEO, Fluenta
Oleg is co-founder and CEO of Fluenta. He spent the last decade shipping products across fintech, commerce, and AI tooling, and now leads Fluenta's work scoring startup ideas against 25 live market and social data feeds.
Related Resources
Fluenta Research
The State of New Business Ideas: H1 2026
235,039 business-idea launches collected, August 2025 to June 2026. What got built, what died, and what the model releases changed.
Validation
130 SaaS Ideas Scored: The Q2 2026 Saturation Report
130 SaaS ideas scored on saturation and fundability from our live data. 19 outliers sit in the fundable-but-uncrowded quadrant. Updated weekly.
Validation
89 AI Startup Ideas Ranked by Live Demand Data (2026)
89 AI-native ideas (from 130 scored) ranked against live demand, search, and complaint data. 31 still defensible. Filtered by humans, not by ChatGPT.
Score your idea in 20 minutes
Run Fluenta X-Ray on your idea. 25 live market + social feeds. Real demand data, real competition, real willingness-to-pay signals. From $7. 20 minutes.
Was this helpful?