State of New Business Ideas, Sep 2026: 77,717 Launches

September 2026 put 77,717 records of new business ideas on file: 22,974 Product Hunt listings, 3,708 Show HN threads, 2,835 new GitHub repositories, a Y Combinator batch, hackathon entries, and 44,178 Reddit posts from seven builder subreddits. This edition follows the July and August edition and reads the month the same way: collect everything, score a subset on the Launch Readiness Score (LRS), report what the numbers separate.
The month's event was a release that developers rushed to build on, and it was the second of its kind in six weeks. Jev, announced on 15 September, was 17.7 percent of all new GitHub repositories above 50 stars within fifteen days. DeepSeek Harness, open-sourced on 13 August, had been 13.2 percent. Both waves peaked inside two days and were gone inside nine, and in both the product platforms saw a small fraction of what GitHub saw. Two releases make a shape that can be measured. That shape, and what it does to the odds of a launch, is what this report is about.
Key Takeaways
Three of the month's four highest-scoring ideas. The 77,717 records are everything collected: every launch, post and mention across 52 sources. Scoring is a second, narrower step. 126 ideas that resurfaced across those sources were run through the Launch Readiness Score (LRS), six pillars out of 100. The cards below are ranks 2, 3 and 4 of that set; the first-ranked idea, a remote bookkeeping service at 57.7, has no public page yet and sits in the table further down.

Agent Context Compaction Layer
Source: GitHub
Apple TV Control Server
Source: PyPI
Procurement Orchestration Platform
Source: TopStartupsThe index reads 55.1: active demand, and buyers who pay
September's Business Idea Demand Index is 55.1. The short version for a founder: this is a build-friendly market, as long as you build into demand someone is already paying for.
Here is what the number means. 55.1 sits on the line between the Stirring band (40 to 55) and the Busy band (55 to 70), so appetite for new ideas is active, not flat. And the figure that matters most to a founder is strong: among this month's 103 ordinary ideas, monetization proof runs at 92 percent of maximum. People are not just interested, they are paying.
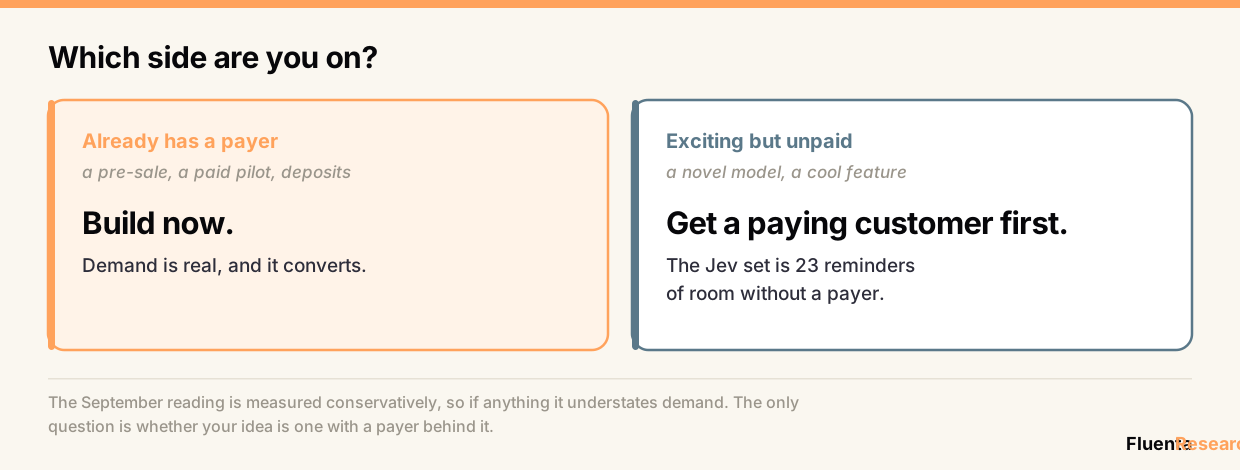
So should you build? Yes, if your idea already has a payer behind it. The market is open and converting. Scarce demand is not the risk this month.
The risk is what you build. The worst-scoring cluster was the 23 ideas built on the brand-new Jev model: they top the series on competitive room but show almost no monetization proof, 18 out of 100 against 76 for everything else. A new model creates space, and space is not a paying customer. That is the trap.
Two releases in six weeks made the same wave
Five dated sources carry this section: new GitHub repositories above 50 stars, Hugging Face models and spaces, Show HN posts, Reddit posts in seven builder subreddits and Product Hunt listings. Each records the day something appeared, which makes it possible to follow one event across all five and put a clock on it.
There were two events to follow. DeepSeek Harness, an open-source coding-agent runtime, went public on 13 August. Jev, a model from TypeSafe AI that returns a typed decision, a choice, a score or a yes or no, where a language model returns text, was announced on 15 September in early access behind a waitlist. Laya, an open-source model that describes itself as Jev-compatible, appeared three days later. Name matches on titles and descriptions find 523 Jev and Laya items in the fifteen days after the announcement.
Both waves peaked inside two days and were gone in nine
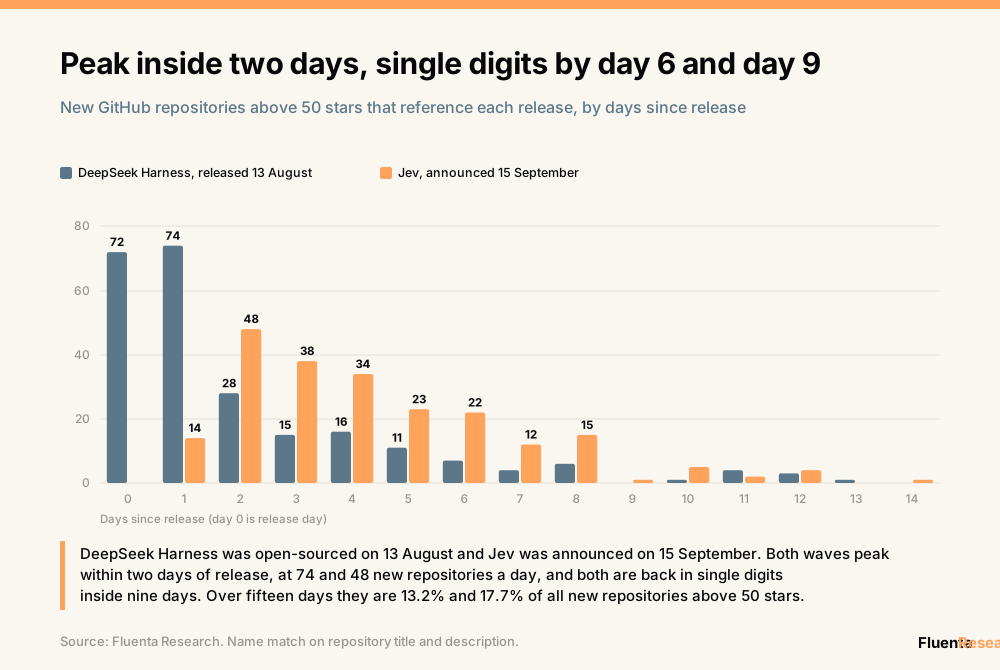
DeepSeek Harness produced 74 new repositories above 50 stars on the day after release and was in single digits by day 6. Jev produced 48 two days after its announcement and was in single digits by day 9. Over fifteen days the Harness wave was 13.2 percent of new repositories and 54 percent of all the stars they earned; the Jev wave was 17.7 percent and 37 percent. Late-month repositories have had less time to reach 50 stars, so the Jev share is a floor: over its first eight days it was 24.9 percent. Two of the three most-starred new repositories of September belong to the wave, Laya at 29,748 stars and browser-use's jev-ultrafast at 21,678. The outlines match and the details differ: Harness was open on day zero, spiked at once and halved within two days; Jev sat behind a waitlist, took two days to peak and held near its peak for five.
What gets built in a wave is mostly plumbing. Of 222 Jev repositories in the month, 68 are agent and coding harnesses, 19 are ports and runtimes for other hardware, 11 are clones and fine-tunes and 22 read as end-user applications; the other 102 are demos, benchmarks and experiments that fit no bucket.
Code filled up and products stayed scarce
How far each wave travelled is the second measurement. GitHub is collected at 50 stars and above, so the comparison cuts every platform at 50: likes, points, upvotes, votes.
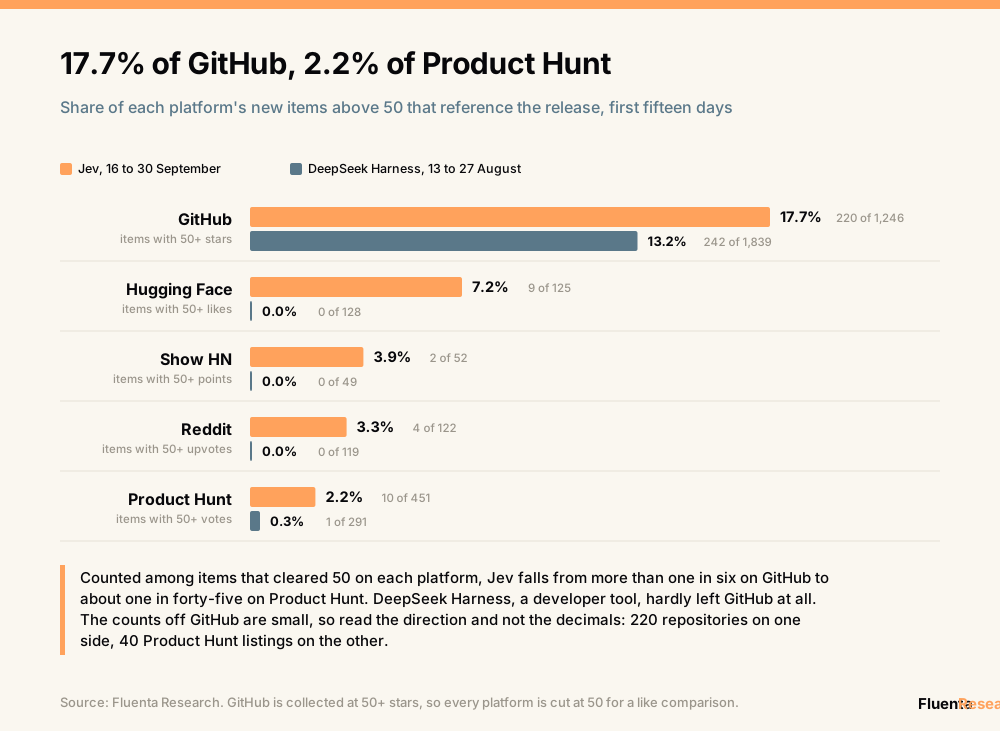
Jev was 17.7 percent of GitHub, 7.2 percent of Hugging Face items above 50 likes, 3.9 percent of Show HN posts above 50 points, 3.3 percent of Reddit posts above 50 upvotes and 2.2 percent of Product Hunt launches above 50 votes. The counts behind the last three are small, 2, 4 and 10 items, so the direction is the point and the decimals are not: the share falls at every step from the platform where code ships to the platform where products launch. Counted over every Product Hunt listing, with no traction cut, Jev was 0.3 percent: 40 listings among 12,260, the first on day four. DeepSeek Harness, a developer tool, barely left GitHub: 16 Product Hunt listings in fifteen days and one above 50 votes.
The few products were not ignored. Ten of the 40 Jev launches on Product Hunt passed 50 votes, against 36 per thousand for everything else launched in the same days, and Jev's own launch on 21 September took 538 votes, ninth for the month. But eight of the ten stopped short of 100, and on Show HN posts about Jev did slightly worse than the rest, 19 against 28 per thousand above 50 points. Forty launches cannot show that scarcity pays. They do show where the crowd was: 220 repositories on one side, 40 products on the other.
The ideas built on Jev show room, and no payer yet
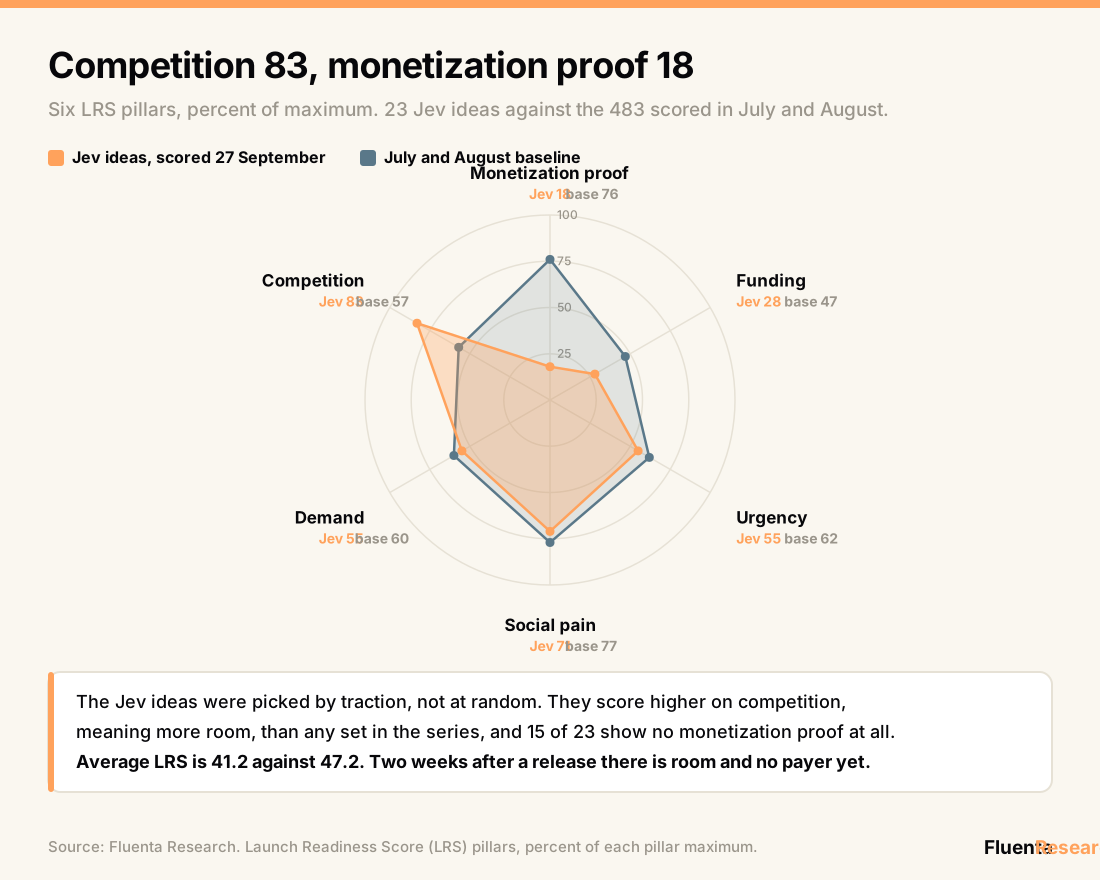
The scored layer gives a second reading of the same wave. Twenty-three ideas built on Jev were run through the Launch Readiness Score (LRS) on 27 September with every evidence feed live. They were chosen by traction on Product Hunt, GitHub, Reddit and Show HN, not at random, and are set against the 483 ideas scored in July and August.
View the pillar scores+
| Pillar | Jev ideas | Jul-Aug baseline | Gap (points) |
|---|---|---|---|
| Competition | 83 | 57 | +26 |
| Social pain | 71 | 77 | -6 |
| Demand | 55 | 60 | -5 |
| Urgency | 55 | 62 | -7 |
| Funding | 28 | 47 | -20 |
| Monetization proof | 18 | 76 | -58 |
Competition, where a higher score means more room, is 83 percent of maximum, the highest of the 56 sets of ten or more ideas scored since March. Monetization proof is 18 percent against 76 in the baseline, and 15 of the 23 ideas show none at all. Average LRS is 41.2 against 47.2. A sceptic will say that payment proof cannot exist two weeks after a release, and that is the finding, not a flaw in it. The fair comparison is ideas from the same kinds of source scored in July and August, 76 of them from Product Hunt, GitHub and Show HN: they read 61 on competition and 67 on monetization proof. A wave buys attention and an empty field. It does not come with a buyer.
One of the 23 is worth naming. A Reddit launch that drew 220 upvotes used the model to score project ideas in parallel, the same job the scoring in this report does. Run through the LRS, it scored 38.5.
Attention moved in two days. Do buyers find your site?
Free AI-search visibility audit of a live website: whether ChatGPT and Google AI mention it when buyers ask. 24 hours, human-checked.
Free. No subscription, no card, no sales call required. 24 hour turnaround, checked by a human analyst.
Which ideas rose, and which faded
The first half of 2026 belonged to applied AI: the ideas launching fastest were AI sales and outreach tools, legal and contract AI, fintech, and e-commerce helpers. September tells a different story. Tracking the same concepts across every source Fluenta monitors, and measuring launch rate per ten thousand titles so a larger month does not masquerade as growth, the two concepts that led the first half have both turned down. AI sales and outreach fell about nineteen percent from December, and legal and contract AI fell about eleven percent. What is rising now sits one layer deeper in the stack: self-hosted and privacy tooling, invoice and expense automation, and fintech infrastructure. The shift holds whether the count comes from Reddit alone, from the launch platforms and code hosts, or from both combined.
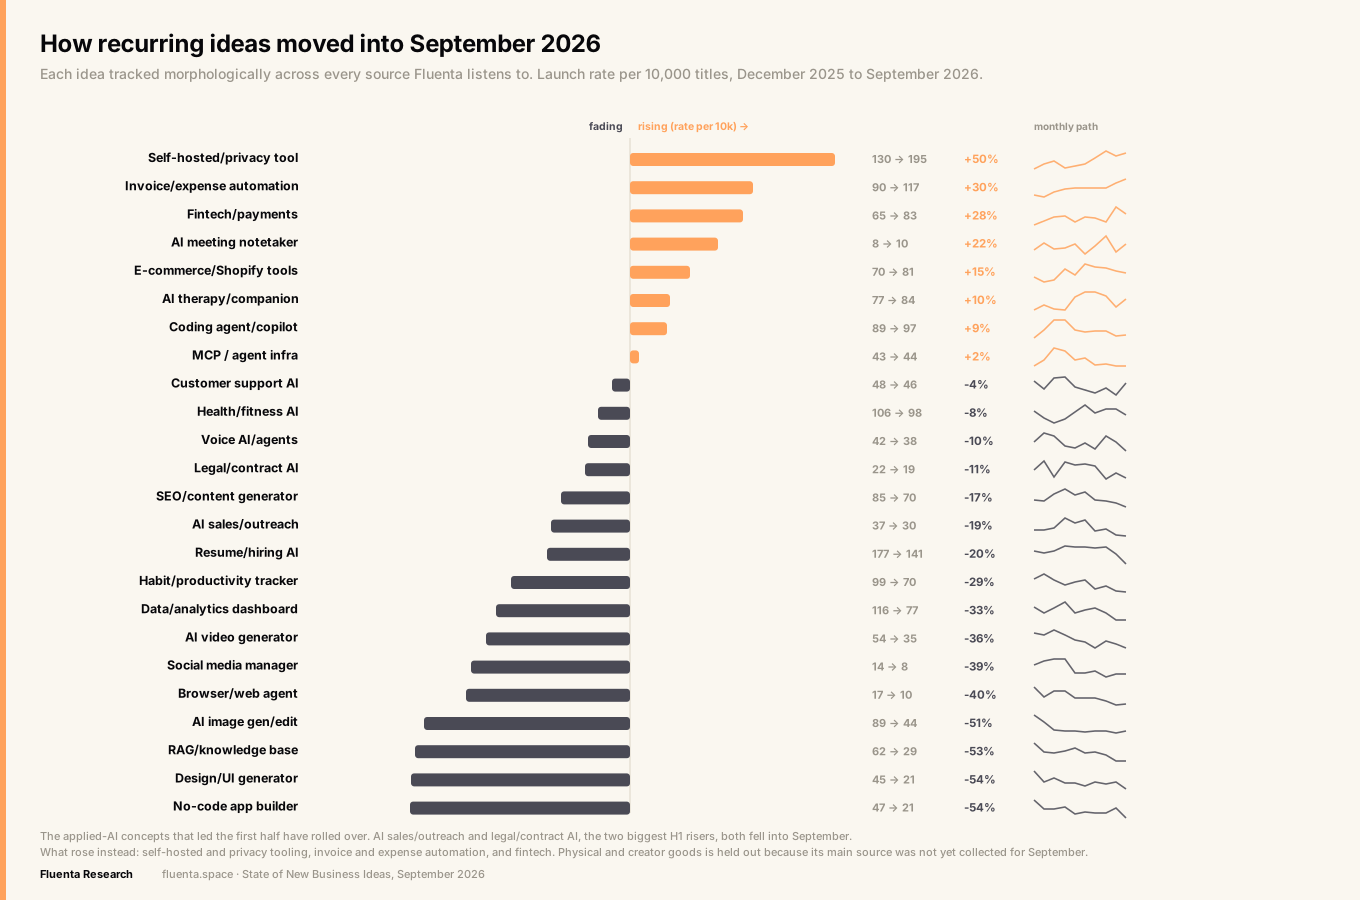
View all 24 concepts+
| Concept | Change | Dec rate (per 10k) | Sep rate (per 10k) |
|---|---|---|---|
| Self-hosted/privacy tool | +50% | 130 | 195 |
| Invoice/expense automation | +30% | 90 | 117 |
| Fintech/payments | +28% | 65 | 83 |
| AI meeting notetaker | +22% | 8 | 10 |
| E-commerce/Shopify tools | +15% | 70 | 81 |
| AI therapy/companion | +10% | 77 | 84 |
| Coding agent/copilot | +9% | 89 | 97 |
| MCP / agent infra | +2% | 43 | 44 |
| Customer support AI | -4% | 48 | 46 |
| Health/fitness AI | -8% | 106 | 98 |
| Voice AI/agents | -10% | 42 | 38 |
| Legal/contract AI | -11% | 22 | 19 |
| SEO/content generator | -17% | 85 | 70 |
| AI sales/outreach | -19% | 37 | 30 |
| Resume/hiring AI | -20% | 177 | 141 |
| Habit/productivity tracker | -29% | 99 | 70 |
| Data/analytics dashboard | -33% | 116 | 77 |
| AI video generator | -36% | 54 | 35 |
| Social media manager | -39% | 14 | 8 |
| Browser/web agent | -40% | 17 | 10 |
| AI image gen/edit | -51% | 89 | 44 |
| RAG/knowledge base | -53% | 62 | 29 |
| Design/UI generator | -54% | 45 | 21 |
| No-code app builder | -54% | 47 | 21 |
No AI peak and no rebound: the rooms differ
Four platforms carry this section, with three months on each: Product Hunt (65,347 listings), GitHub (10,245 repositories), Show HN (11,314 posts) and Reddit (74,880 launches). A launch counts as AI-labelled when its title or tagline uses AI, LLM, GPT, agent or copilot. A hit is each platform's own threshold of notice: 100 votes, 1,000 stars, 100 points, 100 upvotes.
The label wins on Product Hunt and loses on Reddit and Show HN
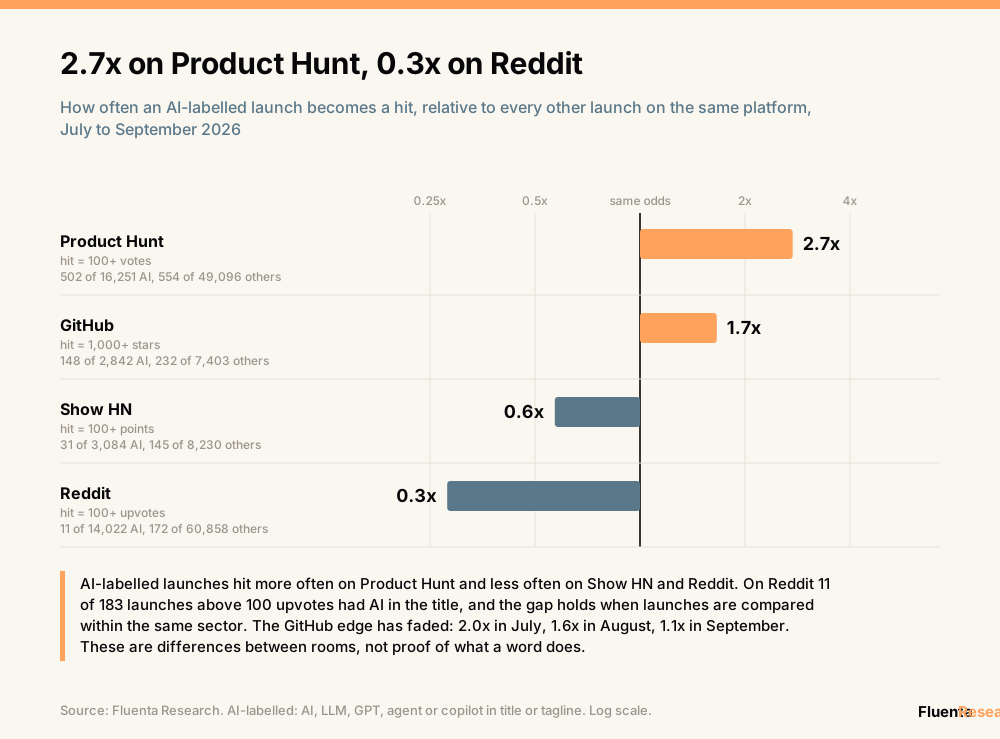
On Product Hunt an AI-labelled listing passes 100 votes 2.7 times as often as any other, and eighteen of September's twenty most-voted launches carry the label. On Show HN the ratio is 0.6, and two of September's top twenty carry the label, one of them a terminal assistant whose headline promise is that it does not use LLMs. The most-upvoted Show HN post of the month, at 2,390 points, is an e-ink frame that listens for birds and draws them. On Reddit the ratio is 0.3: 11 of the 183 launches that passed 100 upvotes in three months had AI in the title. GitHub's edge has faded to nothing: 2.0 in July, 1.6 in August, 1.1 in September.
| Platform | What counts as a hit | AI-labelled, hits per 1,000 | All others, hits per 1,000 | Ratio |
|---|---|---|---|---|
| Product Hunt | 100 votes | 30.9 | 11.3 | 2.7x |
| GitHub | 1,000 stars, among repositories above 50 | 52.1 | 31.3 | 1.7x |
| Show HN | 100 points | 10.1 | 17.6 | 0.6x |
| 100 upvotes | 0.8 | 2.8 | 0.3x |
The Reddit result is the sturdy one. Eleven hits is a small count, but the ratio is 0.28 at 50 upvotes (20 of 335), 0.28 at 100 and 0.39 at 200, and it is 0.29 when launches are compared only with others in the same sector. Sector by sector the counts are thin, but AI-titled launches do worse in 16 of 18 sectors. This is a correlation, and it is a consistent one: on Reddit the word in the title goes with being ignored.
On Product Hunt the word adds almost nothing
Product Hunt is the one platform where each launch is filed under topics, which makes it possible to hold the kind of product still and look at the wording alone.
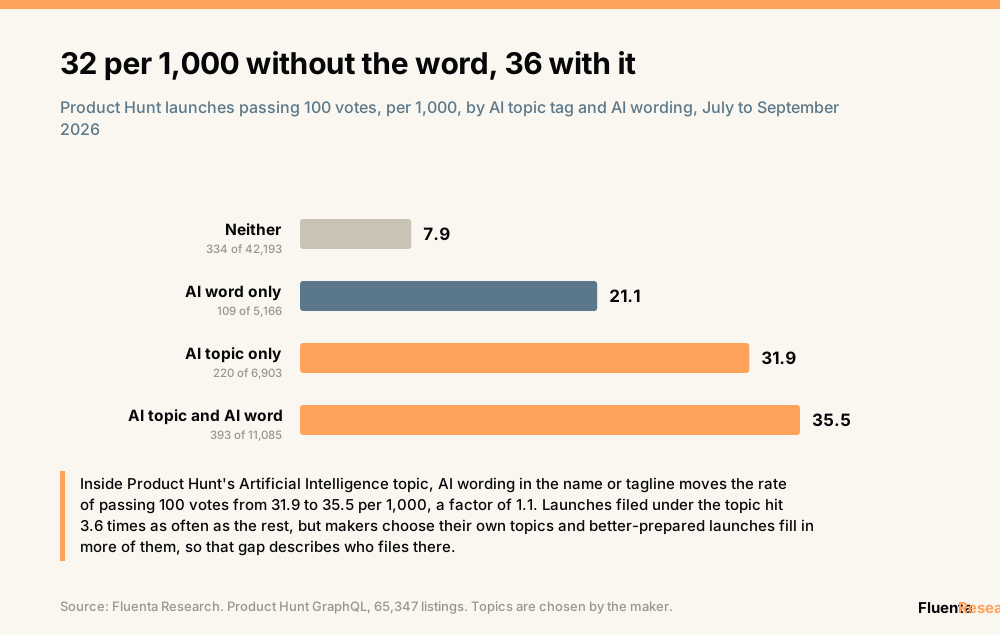
So most of the headline 2.7 is not the word. Inside the AI topic the wording is worth a factor of 1.1; the rest is the kind of product, plus the dead tail, since listings nobody votes on carry the label less often. The topic gap itself should not be read as a lever either. Makers choose their own topics, the gap narrows from 3.64 to 1.5 among launches with ten or more votes, and the API and developer-tools topics show gaps of the same size. Rewriting a tagline changes very little on Product Hunt, in either direction.
The August peak reading does not hold
The last edition read the falling AI share of launches as a peak and named the result that would prove it wrong: a rise on all three launch platforms in September.
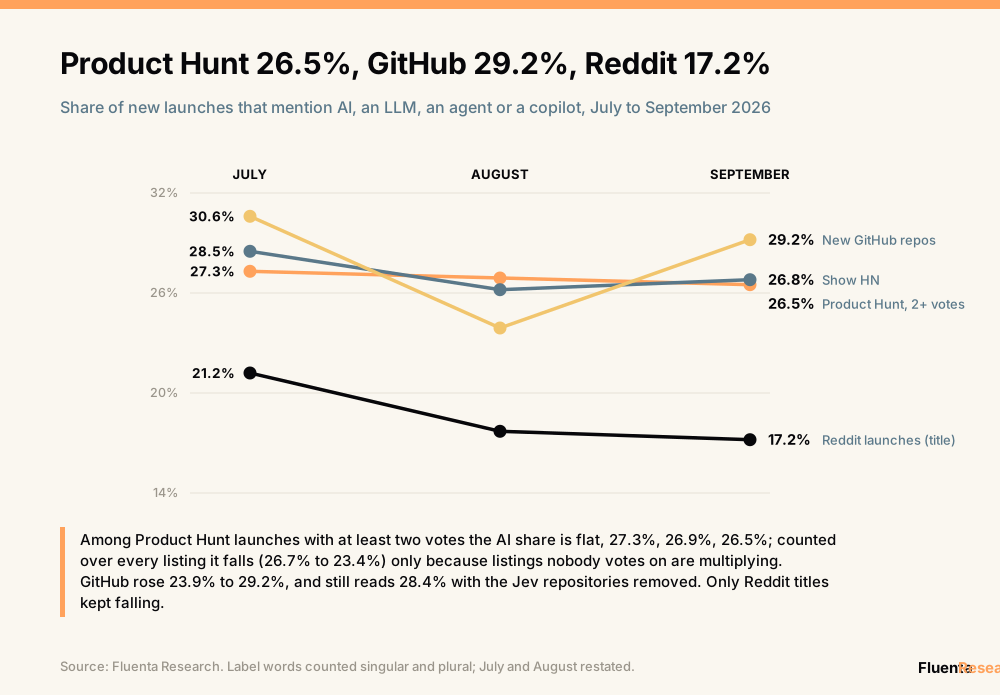
GitHub rose from 23.9 to 29.2 percent, and still reads 28.4 with the Jev repositories removed. Show HN rose from 26.2 to 26.8. Product Hunt fell from 24.7 to 23.4 percent across all listings, but that fall is produced by the growth of listings nobody votes on. Among launches with at least two votes the share is flat at 27.3, 26.9 and 26.5 percent, and among launches with ten or more it is 40.9 percent. By the letter of the test the reading survives, because Product Hunt's all-listing share fell. By its substance it does not: two platforms rose and the third is flat once listings nobody votes on are set aside. All three are also still below July. The data supports no trend in either direction, and the August claim of a peak is withdrawn. Only Reddit titles kept falling, from 21.2 to 17.2 percent, which fits a room where the word goes with being ignored.
On Reddit the AI build-out stopped falling
Reddit is the only source long enough to show a curve: ten months and 250,360 launches, each assigned to one of nineteen sectors by what it does and not by its title.
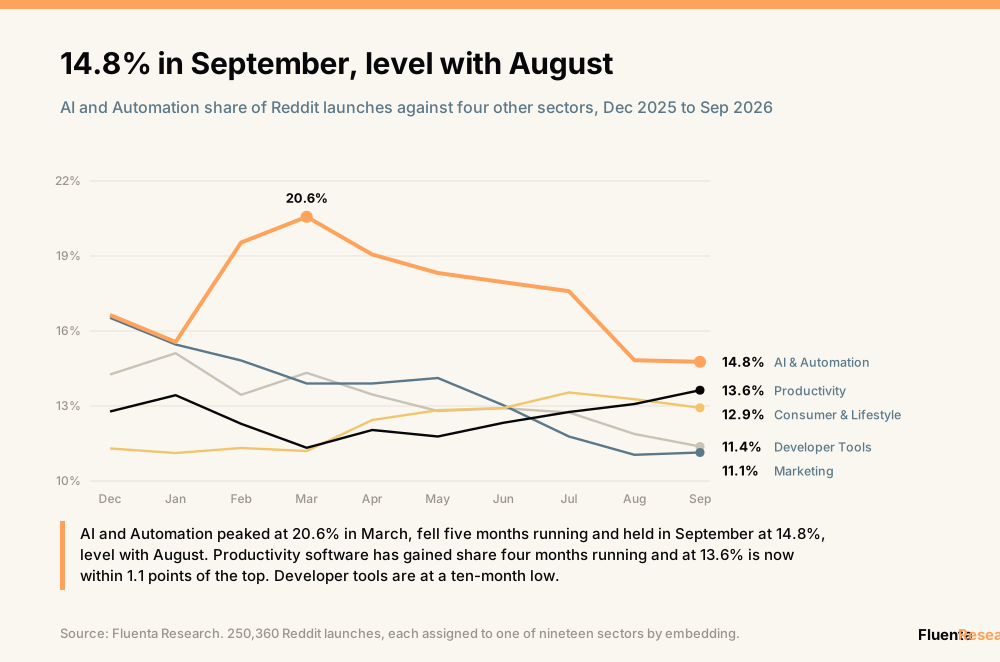
AI and Automation peaked at 20.6 percent of launches in March, fell five months running and held in September at 14.8 percent, level with August. Productivity software has gained share four months in a row and at 13.6 percent is within 1.1 points of the top. Developer tools are at a ten-month low. One caution on this series: the share of launches too ambiguous to classify has grown from 5.7 to 9.6 percent over the ten months, so small moves between sectors should not be over-read.
Get the ideas that outlast the wave
23 ideas built on the month's biggest release averaged LRS 41.2. Each week, the ideas that pass the monetization test, with the six-pillar read on each. Free account.
Free. Subscribing creates your Fluenta account so you can score your own ideas too.
Six in ten Product Hunt listings now get one vote or none
Product Hunt is collected complete: 22,974 listings in September, each with its vote count. The figure most often quoted about it, that the median launch gets one vote, is a statement about listings, and listings and promoted launches have come apart.
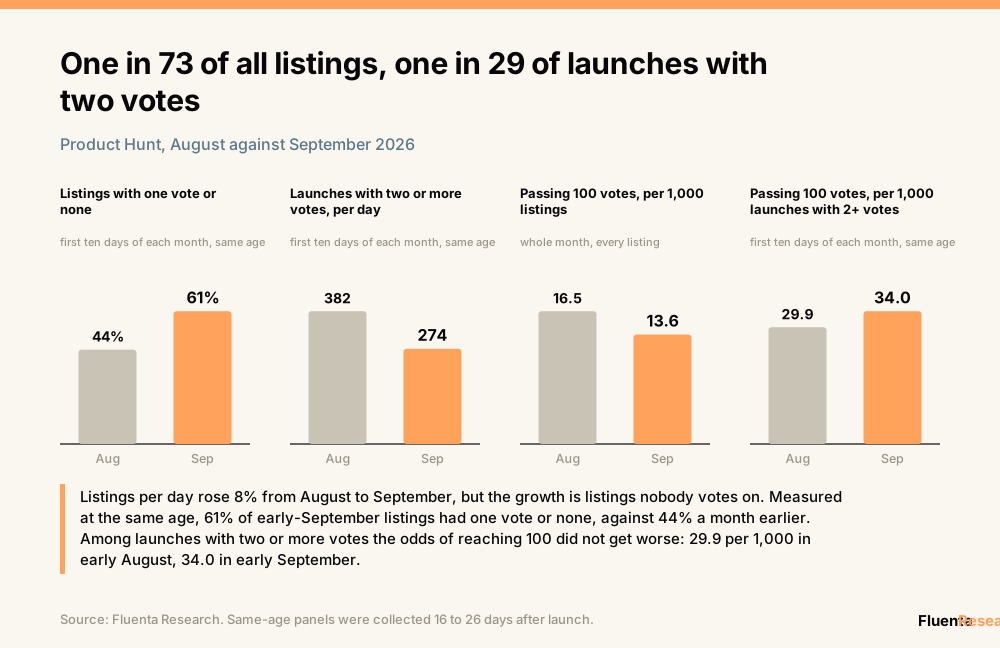
Listings per day rose from 710 in August to 766 in September. Measured at the same age, 16 to 26 days after launch, 61 percent of early-September listings had one vote or none, against 44 percent of early-August ones, and launches with two or more votes fell from 382 to 274 a day. The share has climbed in every ten-day cohort since early July, 7, 17, 33, 44, 47 and 68 percent, before settling near 60 in September. Older cohorts have had longer to collect a second vote, so part of that slope is age, but a rise this steep is more than age. Either far more unpromoted listings are being submitted, or the platform now exposes listings it used to hold back. The collection cannot tell which. The top of the distribution thinned too: 380, 363 and 313 launches passed 100 votes in July, August and September, and 135, 124 and 112 passed 200. The middle did the opposite: 560 launches passed 50 votes in August and 675 in September.
That gives two base rates, and they describe different things. Across every listing, 13.6 per thousand passed 100 votes in September, one in 73, down from 16.5 in August. Among launches with at least two votes, compared at the same age, the rate was 29.9 per thousand in early August and 34.0 in early September, one in 33 and one in 29. The second rate is a description, not a lever: every winner has two votes, so getting two votes does not buy those odds. What it shows is that the falling headline rate comes from the growing pile of untouched listings and not from a harder contest among launches that were promoted at all. Nor is the number of winners capped: days with about 492 listings produced 8.2 launches above 100 votes, days with about 939 produced 13.8.
On Reddit, what gets built is not what gets noticed
Reddit, the largest source, gives a reading by sector. Of September's 24,819 launches across seven builder subreddits, 68 percent drew no reaction at all and 7.9 percent were noticed, meaning five or more upvotes or comments, both in line with August.
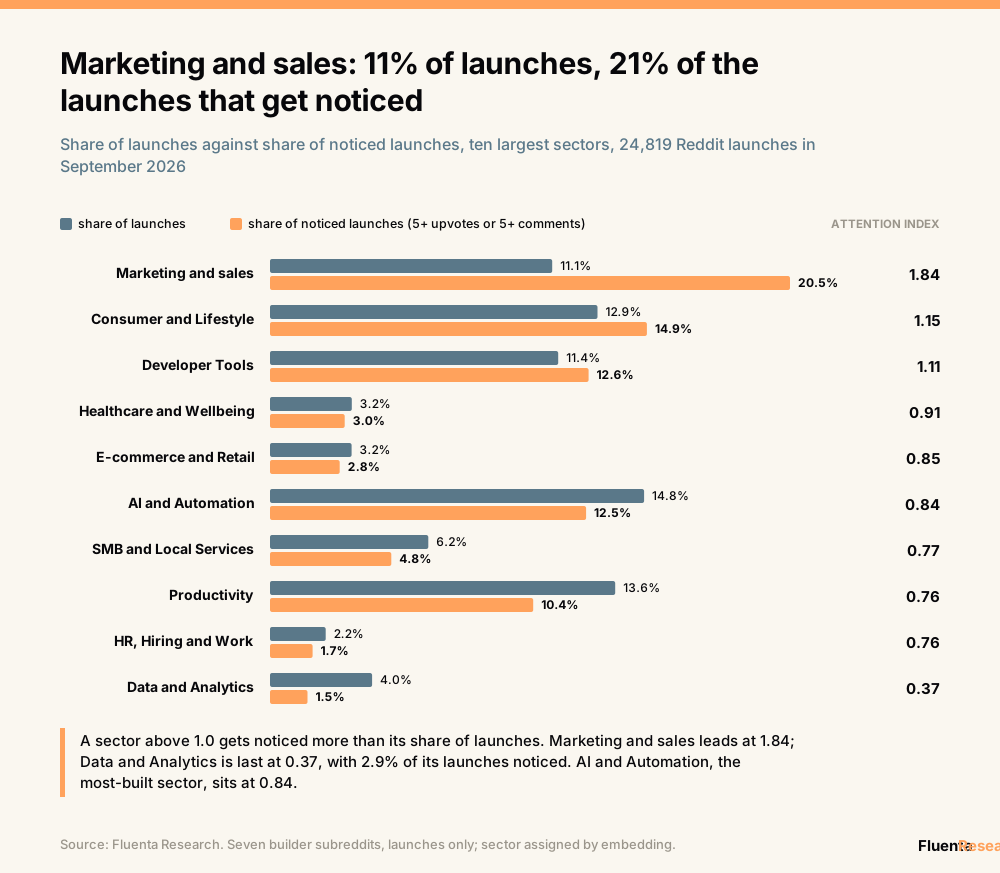
Marketing and sales tools are 11 percent of launches and 21 percent of the launches that get noticed, an attention index of 1.84. Data and analytics tools sit at 0.37, with 2.9 percent noticed. AI and Automation, the most-built sector, is at 0.84. The caveat from the last edition still applies: the best-performing marketing posts are founders talking to founders about founding, so the index measures what the room rewards and not what a buyer wants.
Six in ten listings got one vote or none. See where buyers look instead
Free AI-search visibility audit of a live site: whether ChatGPT and Google AI mention it when buyers ask. 24 hours, human-checked.
Free. No subscription, no card, no sales call required. 24 hour turnaround, checked by a human analyst.
The best new business ideas of September 2026, by LRS
The scored layer for the month is 126 ideas in three sets. The ranking below holds within the month, because the evidence gap of 12 September applied to every idea scored that day, but the levels for those 103 ideas are understated. No idea passed LRS 60, against 5 in August; 10 passed 55. Read the order, not the level.
Developer tools took five of the top ten
The highest LRS of the month is 57.7, a remote bookkeeping service first spotted on the App Store. Each row opens to its pillar breakdown; the LRS is weighted and is not the sum of the six.
The top 10 by Launch Readiness Score
Search by name or sector, sort by score, and open any idea to see its six-pillar breakdown.
Remote Bookkeeping Service57.7›
LRS breakdown
Agent Context Compaction Layer57.5›
LRS breakdown
Apple TV Control Server56.9›
LRS breakdown
Procurement Orchestration Platform56.4›
LRS breakdown
Automation API Client Library56.2›
LRS breakdown
WordPress Content Builder Theme56.1›
LRS breakdown
Browser-Based Screen Recorder56.1›
LRS breakdown
WordPress Multilingual Translation Plugin55.8›
LRS breakdown
Mobile Coding Agent Orchestrator55.7›
LRS breakdown
Instagram DM CRM55.3›
LRS breakdown
Ranked by Launch Readiness Score across 126 ideas scored in September 2026. Scores are out of each pillar's maximum. 103 of the 126 were scored with two evidence feeds down, so levels are understated; the order is not.
Developer tools take five of the ten places and accounting two. The sources are the plain kind: Product Hunt, Show HN, GitHub, package registries and the App Store. Research and press sources supplied 33 of the 126 ideas and placed none in the top ten; ideas first spotted in the press averaged LRS 37.9 against 45.3 for ideas from launch platforms, the same direction as every edition so far.
The buildability map: what to actually build
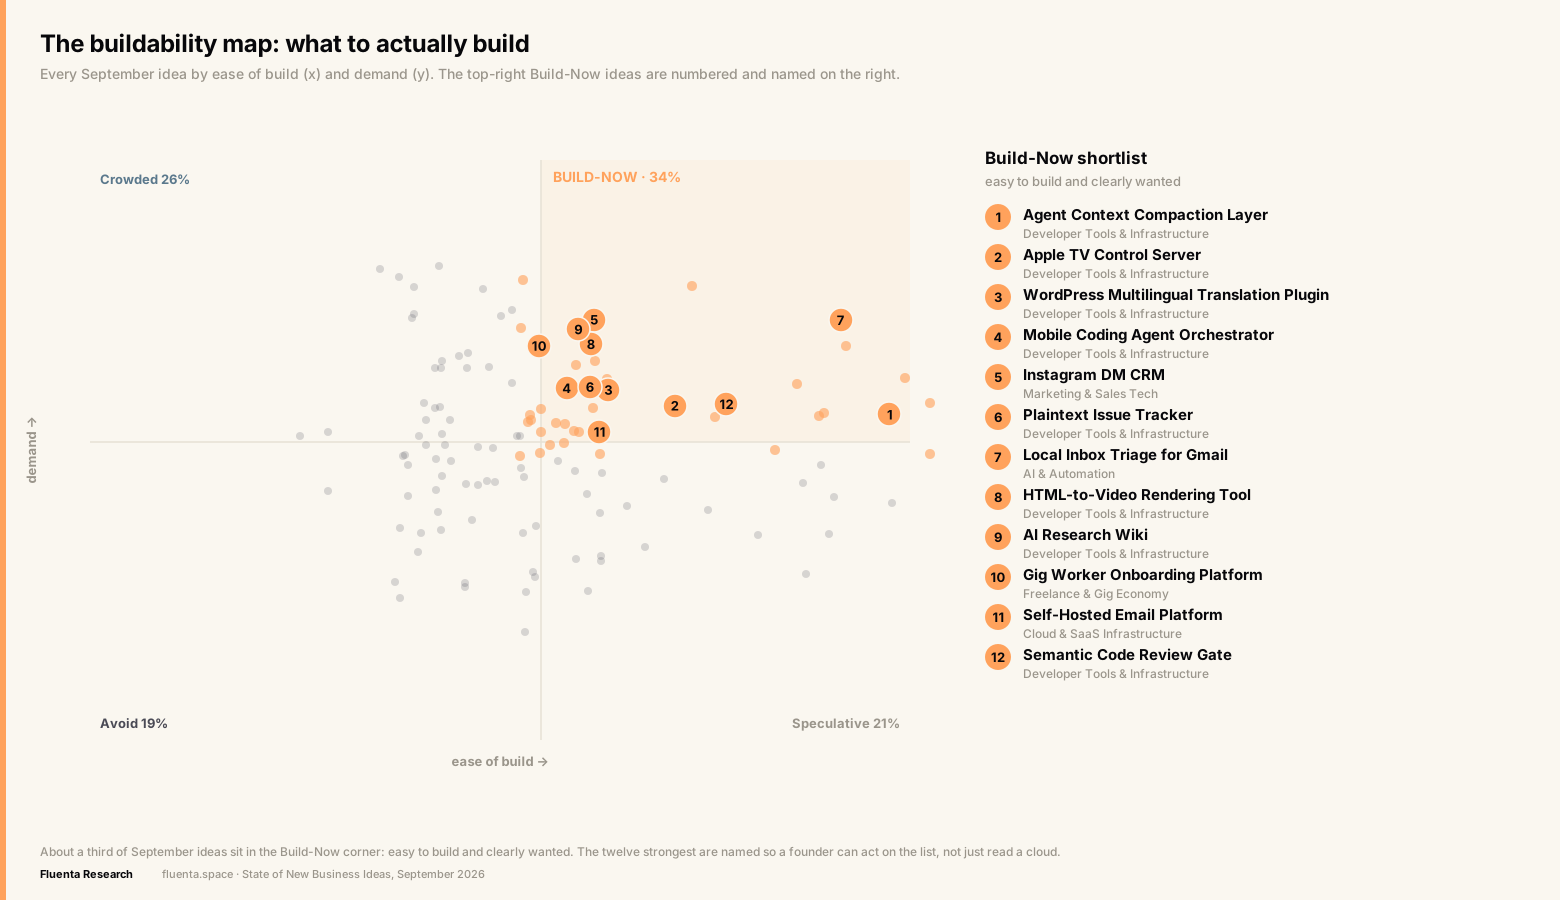
Not every wanted idea is worth starting, and not every easy build has a buyer. The buildability map places all 126 scored September ideas on two axes: how easy each one is to build, and how clearly the market wants it. The corner that matters is the top right, where an idea is both easy to ship and clearly in demand. About a third of September ideas land there. The twelve strongest in that corner are named so the list can be acted on rather than admired, and it leans heavily toward developer tools and infrastructure. Scores are left off this view on purpose: an evidence outage during the September scoring run pushed the underlying readiness numbers down, so the map shows position and rank rather than absolute grades.
View the Build-Now shortlist+
| Rank | Idea | Category |
|---|---|---|
| 1 | Agent Context Compaction Layer | Developer Tools & Infrastructure |
| 2 | Apple TV Control Server | Developer Tools & Infrastructure |
| 3 | WordPress Multilingual Translation Plugin | Developer Tools & Infrastructure |
| 4 | Mobile Coding Agent Orchestrator | Developer Tools & Infrastructure |
| 5 | Instagram DM CRM | Marketing & Sales Tech |
| 6 | Plaintext Issue Tracker | Developer Tools & Infrastructure |
| 7 | Local Inbox Triage for Gmail | AI & Automation |
| 8 | HTML-to-Video Rendering Tool | Developer Tools & Infrastructure |
| 9 | AI Research Wiki | Developer Tools & Infrastructure |
| 10 | Gig Worker Onboarding Platform | Freelance & Gig Economy |
| 11 | Self-Hosted Email Platform | Cloud & SaaS Infrastructure |
| 12 | Semantic Code Review Gate | Developer Tools & Infrastructure |
What this means for a founder in October 2026
Five actions follow, each from a number above and not from general advice.
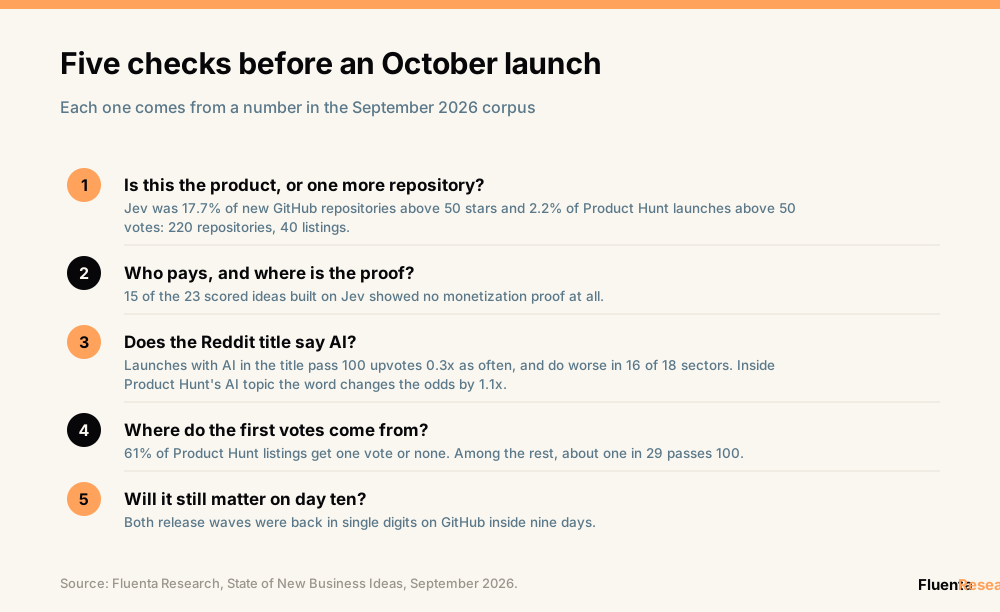
Ship the product, not one more repository. In both waves GitHub filled within two days. Jev was 17.7 percent of new repositories above 50 stars and 2.2 percent of Product Hunt launches above 50 votes: 220 repositories against 40 listings. The data cannot promise that the emptier room pays better. It does say which room is full.
Find the payer before the wave ends. Fifteen of the 23 scored Jev ideas showed no monetization proof. An empty field is evidence that nobody has found the buyer yet, not that the buyer is waiting.
On Reddit, lead with the job, not with AI. Launches with AI in the title pass 100 upvotes 0.3 times as often as the rest, at every threshold tested and in 16 of 18 sectors. That is a correlation, but it costs nothing to act on. On Product Hunt the wording moves the odds by 1.1x, so leave it alone.
Do not plan from the one-vote median. It describes the 61 percent of listings that nobody promoted. A launch with any audience behind it is in a pool where about one in 29 passes 100 votes, and that pool has not become harder. Decide where the first votes come from before the listing goes up.
Judge a release on day ten. Both GitHub waves were in single digits inside nine days. What is still being built after that is a better signal of use than what was starred in the first forty-eight hours.
The same five, as the checks to run before an October launch.
Score your idea against the 126 in this report
Free account, same six-pillar Launch Readiness Score. See where yours lands, then get the week's highest-scoring ideas by email.
Free. Subscribing creates your Fluenta account so you can score your own ideas too.
Method
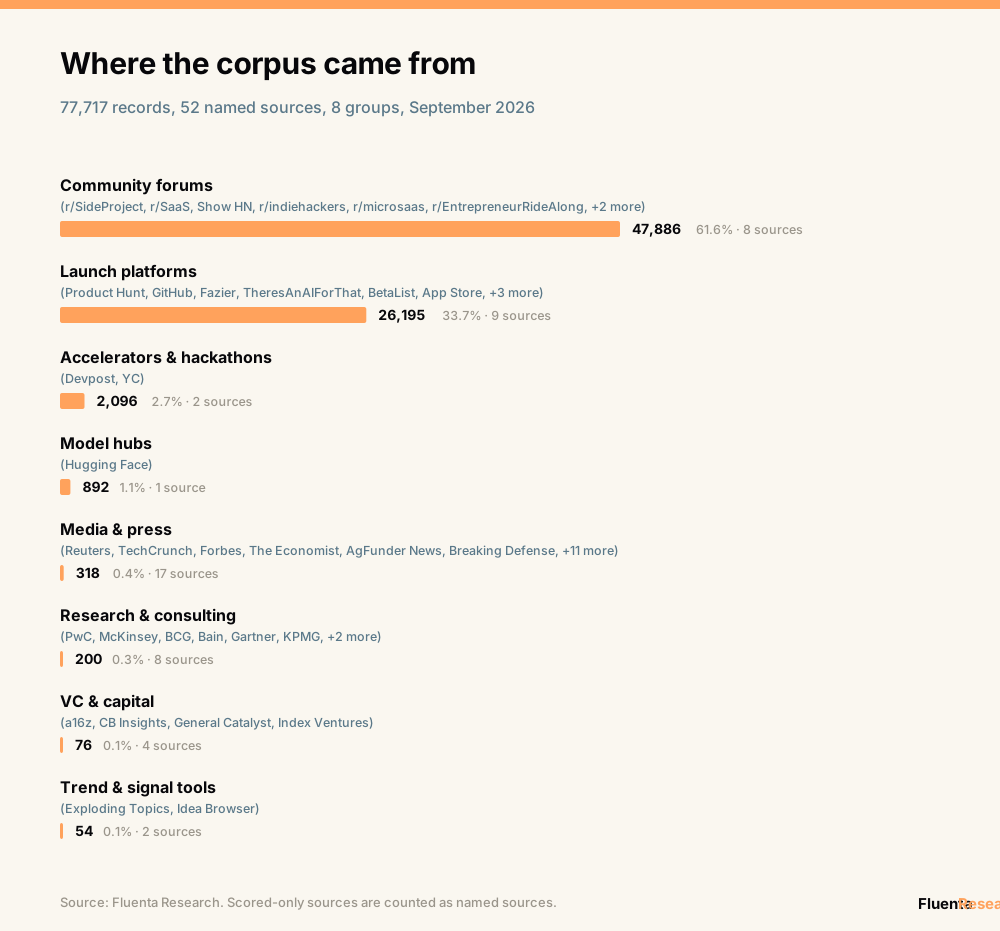
Collection ran from 1 to 30 September 2026 and drew on 52 distinct named sources. 26 of them contributed collected records, in 8 groups; the other 26 appear only through the scored idea sets. The dated channels are Product Hunt (official GraphQL, 22,974 listings), Reddit through Arctic Shift (seven builder subreddits, 44,178 posts), Show HN through HN Algolia (3,708), new GitHub repositories above 50 stars (2,835), Hugging Face models and spaces (892) and Fazier (216). Undated channels are Devpost (1,906 hackathon entries), Y Combinator's Fall 2026 batch (108 companies listed so far), three directories read through the Wayback Machine and a pooled research and press panel of 648 mentions. A record is a launch, post or mention; of the 44,178 Reddit posts, 24,819 are launches by the rule below.
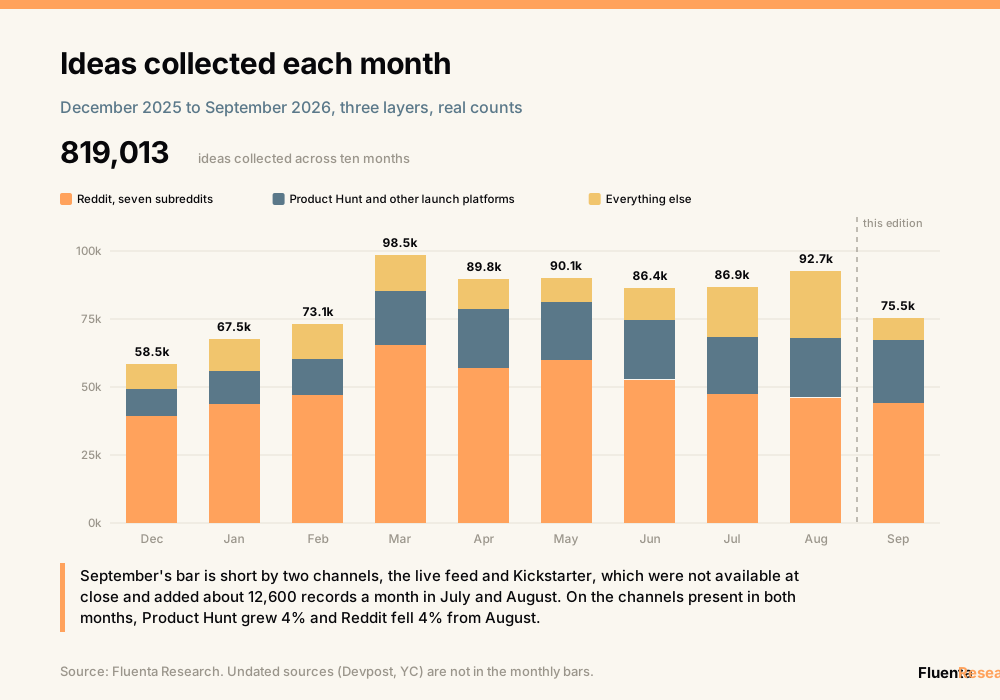
Across the ten months the series now covers, 819,013 dated records have been collected. September's bar is short by two channels. The live idea feed and the public Kickstarter dataset were not available when the month closed; together they added about 12,600 records a month in July and August. They will be restated in the next edition, and no volume claim in this report depends on them.
A Reddit post counts as a launch when it describes something built, shipped or released; questions, discussion threads, deleted posts and promotional reposts are excluded. Each launch is assigned to one of nineteen sectors by embedding, with a 0.25 confidence floor. Noticed means five or more upvotes or five or more comments. Reddit vote counts for 16 to 30 September were collected again on 3 October so that late-month posts had time to settle.
The AI label is counted when a title or tagline contains AI, LLM, GPT, agent, agentic, GenAI or copilot, singular or plural; Show HN and Reddit have titles only. The last edition did not count plurals. July and August are restated here on the new rule, which raises every share (Product Hunt by 0.4 points, GitHub by 1.2 to 1.8, Show HN by about 3.5). In a hand check of 40 unlabelled items, six were plainly AI products, so the label undercounts. The two release waves are name matches in titles and descriptions: Jev, TypeSafe AI and Laya for one, DeepSeek Harness and dsh for the other. Items that use either without naming it are missed, so every wave share is a lower bound.
The scored layer is separate and smaller: 126 ideas in three sets, each carrying a Launch Readiness Score (LRS) out of 100 built from six pillars and only six: demand, social pain, competition, monetization proof, funding and urgency. 103 of the 126 were scored on 12 September while the job-posting and Reddit evidence feeds returned empty for most ideas; those scores are published as measured. The 23 Jev ideas were scored on 27 September with every feed live and were selected by traction.
Five limits apply, stated plainly. The September index has no direction and should not be read against August. Google Trends, used in the last edition, is left out: search interest is normalised inside each query window, and re-pulling the series for August to September reversed moves the July to August pull had shown, so the instrument cannot carry a month-over-month claim. Late-month GitHub repositories have had less time to reach 50 stars than early-month ones, so repository counts are not compared across months and late-month wave shares are floors. Small Product Hunt vote counts are still moving weeks after a launch, so shares of listings with one vote or none are compared only at the same age; the rate of launches above 100 votes is the same in each third of September, whatever the age at collection. Two waves are a pattern, not a law, and one was a developer tool and the other a model: the next release will test it.
Prior editions
The July and August 2026 edition introduced the Reddit layer and the nine-month sector series. The May 2026 edition established the scoring baseline and the source taxonomy. The H1 2026 report covers December 2025 through June 2026, and the top 50 ranked ideas from June 2026 applies the same Launch Readiness Score to a single month.
FAQ
What are the best new business ideas for September 2026?+
Measured, not opined: of 126 ideas scored on the Launch Readiness Score (LRS) in September 2026, the three highest were a Remote Bookkeeping Service (57.7), an Agent Context Compaction Layer (57.5) and an Apple TV Control Server (56.9). Developer tools took five of the top ten places. No idea passed LRS 60, and 103 of the 126 were scored with two evidence feeds down, so the order is reliable and the levels are understated.
What happens on GitHub when a major AI model or tool is released?+
A wave that peaks inside two days and fades inside nine. DeepSeek Harness, open-sourced on 13 August 2026, produced 74 new repositories above 50 stars the day after release and was 13.2% of all such repositories over fifteen days. Jev, announced on 15 September 2026, produced 48 two days after the announcement and was 17.7%. Both were back to single digits a day by day 6 and day 9.
How long does it take a new AI model to turn into products?+
Code arrives within a day and products arrive later and in far smaller numbers. Jev repositories appeared on GitHub the day after the announcement. The first Product Hunt listing came on day four, and after fifteen days Jev was 2.2% of Product Hunt launches above 50 votes against 17.7% of GitHub repositories above 50 stars: 40 listings against 220 repositories.
Is it worth launching a product built on a brand-new model?+
The room is open and the proof of payment is not there yet. Ten of 40 Jev launches on Product Hunt passed 50 votes and two passed 100, too few to say that being early pays. The 23 Jev ideas scored on the Launch Readiness Score averaged 41.2 against 47.2 for the July and August baseline, with competition at 83% of maximum (more room than any other set) and monetization proof at 18%; 15 of 23 showed none.
Does putting AI in a product name help a launch?+
On Reddit it goes with worse results: across July to September 2026, launches with AI in the title passed 100 upvotes 0.3 times as often as others, at every threshold tested and in 16 of 18 sectors. On Product Hunt it barely matters: inside the Artificial Intelligence topic, AI wording in the name or tagline changes the rate of passing 100 votes by 1.1x.
Has AI peaked as a startup category?+
The data shows no trend in either direction. The August 2026 edition read a falling AI share of launches as a peak; September does not support it. The AI share of new GitHub repositories rose from 23.9% to 29.2%, Show HN rose slightly, and among Product Hunt launches with at least two votes the share is flat at about 26%, all still below July. On Reddit, AI and Automation held at 14.8% of launches after five months of decline.
What are the odds of a successful Product Hunt launch?+
It depends on the denominator. In September 2026, 313 of 22,974 listings passed 100 votes, one in 73. But 61% of listings get one vote or none; among launches with at least two votes about one in 29 passed 100. The second figure describes launches that were promoted at all. It is not a promise to a launch that collects two votes.
Is Product Hunt getting harder?+
The headline odds are falling because untouched listings are multiplying, not because the contest among promoted launches is harder. Listings per day rose from 710 to 766 between August and September 2026, and measured at the same age the share with one vote or none rose from 44% to 61%. Among launches with two or more votes, the rate of reaching 100 was 29.9 per thousand in early August and 34.0 in early September.
What is the BIDI index and where does it stand?+
The Business Idea Demand Index is 40 percent quality (average LRS), 25 percent demand, 20 percent monetizability and 15 percent novelty. September 2026 reads 55.1 as measured, against 61.8 in August, and the two cannot be compared: the main scoring run lost its job-posting and Reddit evidence feeds, and 23 of the 126 ideas are a hand-picked set built on a two-week-old model. Without that set the reading is 56.7.
Which sectors get noticed on Reddit, and which get ignored?+
In September 2026, marketing and sales tools were 11% of launches and 21% of noticed launches, an attention index of 1.84. Data and analytics tools were lowest of the ten largest sectors at 0.37. AI and Automation, the most-built sector, sat at 0.84.
What does the Launch Readiness Score measure?+
Each scored idea carries a Launch Readiness Score (LRS) out of 100 built from six pillars and only six: demand, social pain, competition, monetization proof, funding and urgency. A higher competition score means more room in the market, not more competitors. The LRS is weighted and is not the sum of the six pillar scores.
How many sources does the report draw on?+
52 distinct named sources contributed to the September 2026 edition, 26 of them with collected records, for 77,717 records in 8 groups. Community forums supplied 47,886 records and launch platforms 26,195. The live idea feed and Kickstarter were not available at close and are excluded.
Cite this article
Researchers and journalists: this article is freely citable. Click to copy the academic-format reference for your bibliography or footnote.
Ivanov, O. (2026). State of New Business Ideas, Sep 2026: 77,717 Launches. Fluenta. Retrieved from https://fluenta.space/resources/reports/state-of-new-business-ideas.
About the author

Oleg Ivanov
Co-founder & CEO, Fluenta
Oleg is co-founder and CEO of Fluenta. He spent the last decade shipping products across fintech, commerce, and AI tooling, and now leads Fluenta's work scoring startup ideas against 25 live market and social data feeds.
Related Resources
SEO in 2026
Is SEO Dead? What Changed in 2026, and What Works
797,444 impressions, 7 clicks. The hard 2026 data on what died in SEO, what still works, and how to get cited by ChatGPT and AI Overviews.
Report
194 YC Spring 2026 Startups, Scored on Public Data
We scored all 194 YC Spring 2026 startups on six public signals before Demo Day. Four groups, a tight score band, and three questions to ask each founder.
Agent Loops
Agent Loops: 15 AI Agent Business Ideas Ranked by Demand
The Claude loops trend reached 13.6M people in two weeks. Fluenta scored 15 agent-loop business ideas on live demand data: one promising, fourteen experimental.
Score your idea in 20 minutes
Run Fluenta X-Ray on your idea. 25 live market + social feeds. Real demand data, real competition, real willingness-to-pay signals. From $7. 20 minutes.
Was this helpful?